Hack the color map:#
Note
This document is part of a series teaching how to Create a multi-variable image / animation from a coupled ice sheet - climate simulation.
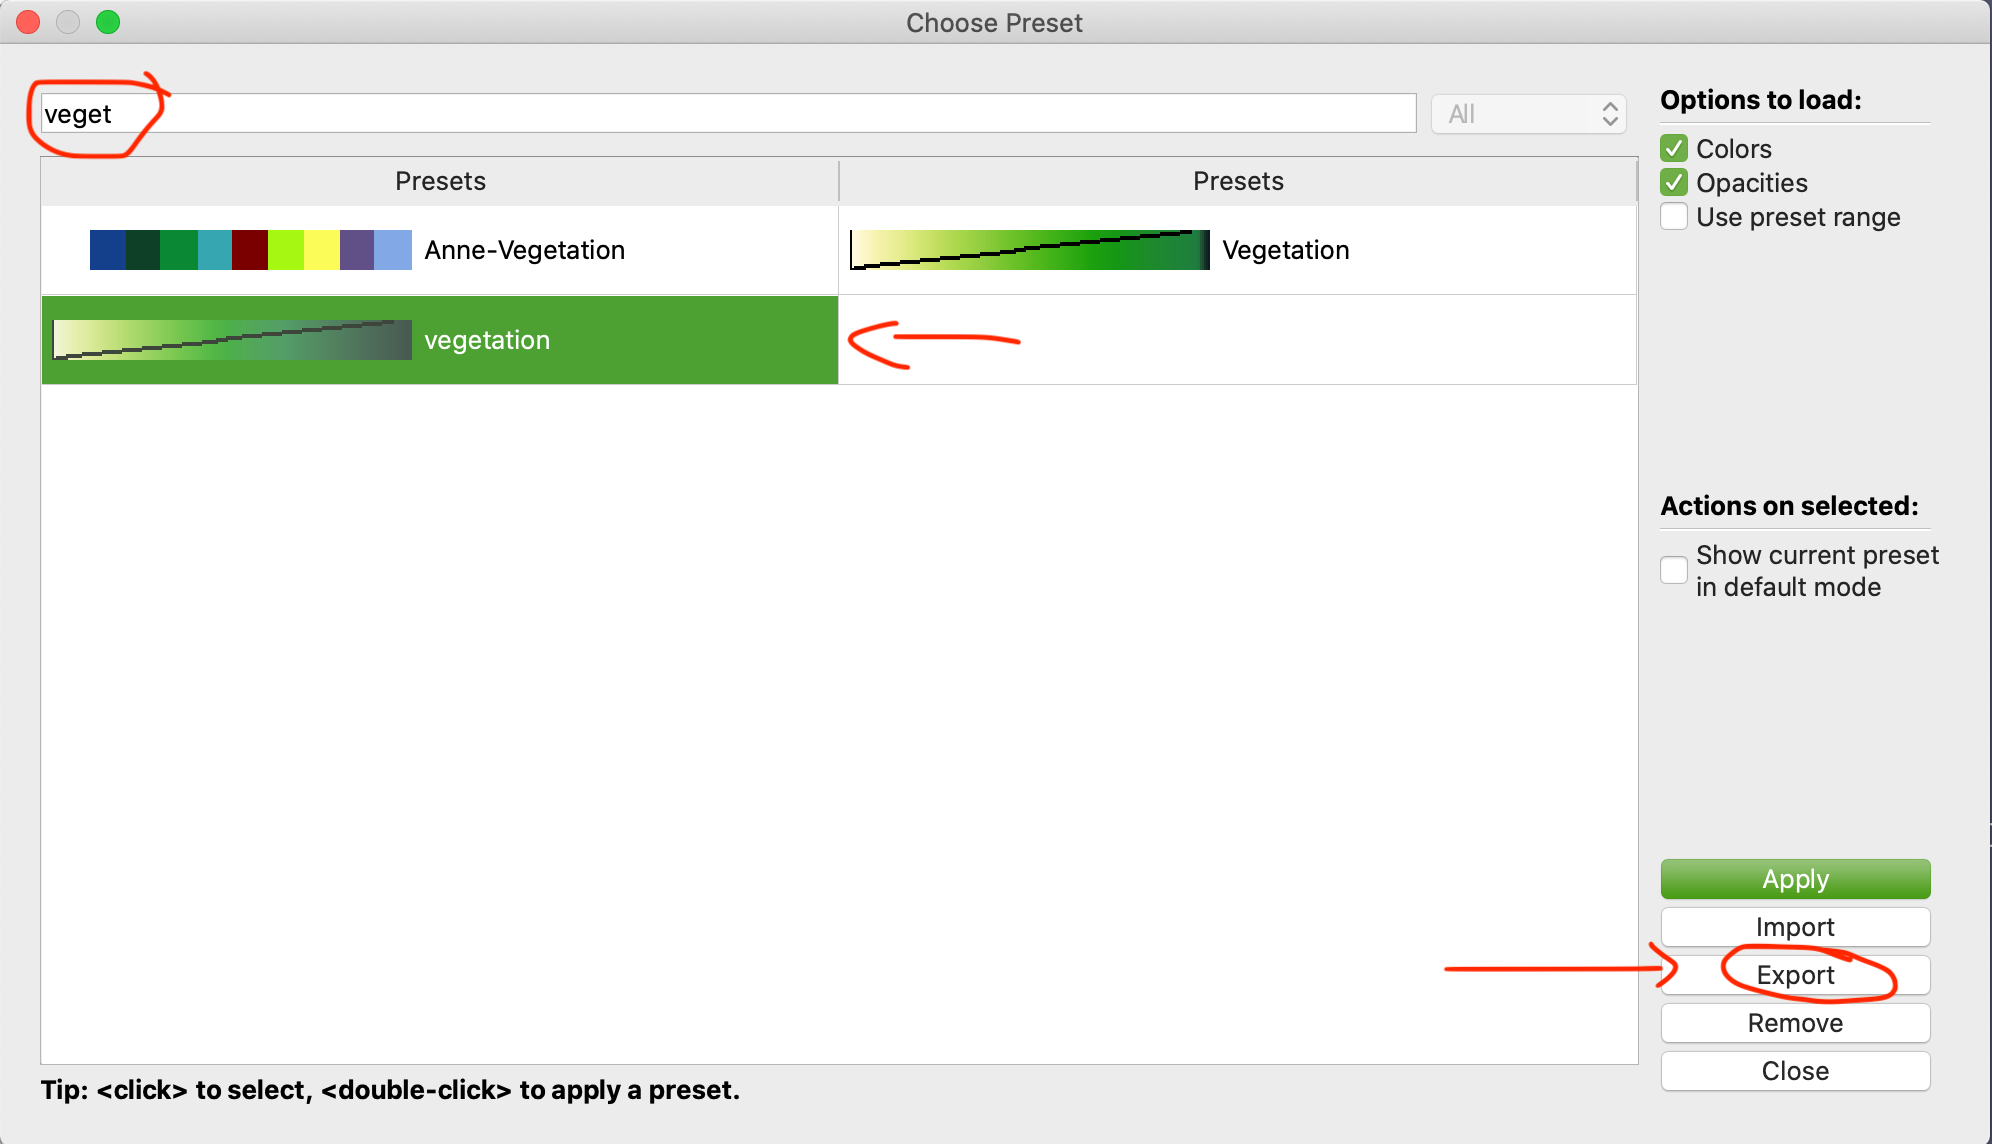
Export the color map

Download the raw color map here
Open the color map in the text editor. In the head edit as indicated, but don’t leave the comments indicated with #:
[
    {
            "ColorSpace" : "Lab",
            "Name" : "Vegetation", ##YOUR NAME
            "Points" :
            [
                    0.0, #NEW MINIMUM VALUE (if you want to change)
                    0.0,
                    0.5,
                    0.0,
                    0.67, #NEW MAXIMUM VALUE
                    1.0,
                    0.5,
                    0.0
            ],
            "RGBPoints" :
            [
                    0.0, # Minimum value, leave as is.
                    1.0, # Red value for lowest point ; set this to 1.0
                    1.0, # Green value for lowest point ; set this to 1.0
                    0.67, # Blue value for lowest point ; set this to 0.67
                    0.050000000000000044, # data value for next point, leave as is
In the lower part, you will find quads with (data value, R, G, B). To change the maximum of the color map in accordance with the change in the header, edit at the bottom (basically matching the previous value):
0.67, # NEW MAXIMUM VALUE
0.118, # RED (if you want to change)
0.5, # GREEN (if you want to change)
0.25 # BLUE (if you want to change)
]
}
Download the edited color map here
Save the file, and import the color map again (same menu as exporting, just one above).
(back to Load the vegetation data)