Use bump-mapping to composite current speed and SST#
Note
This document is related to a series teaching how to Create an image of sea surface speeds
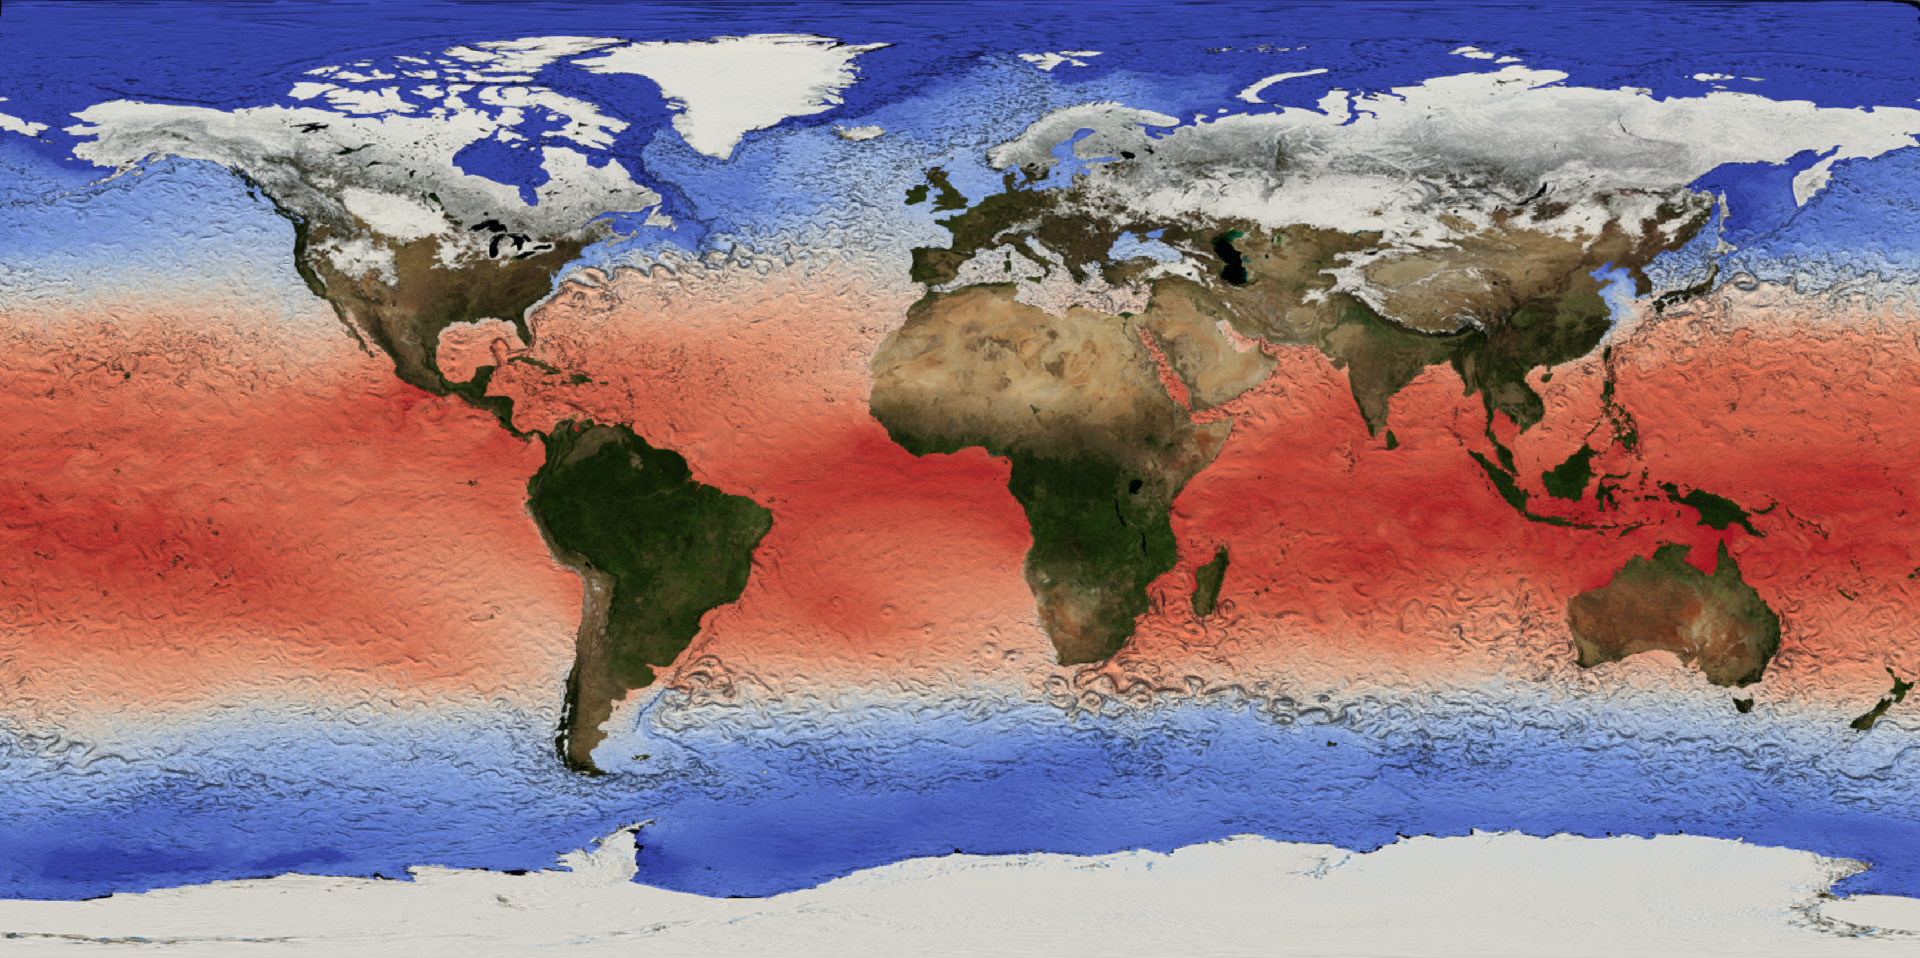
Bump mapping allows you to composite two fields by using “shadow” to display one of them. In the example below, surface current speeds are superimposed on sea surface temperatures.
Bump mapping is part of the EmbossingRepresentations plugin of ParaView. See Activate the CDI reader plugin for instructions on how to activate a plugin, and activate the EmbossingRepresentations.
To use this rendering technique, you need the variable for the embossing present as scalar point data (on the vertices). To obtain this Convert cell data to point data (and chose the array you want to superimpose for processing). In this example, that would be vel computed from u and v with a calculator (see Apply a calculator to convert u and v into speed).
Warning
Note that this technique needs the light kit to be active (fresh paraview or undo of Deactivate the light kit) – no light - no shadow.
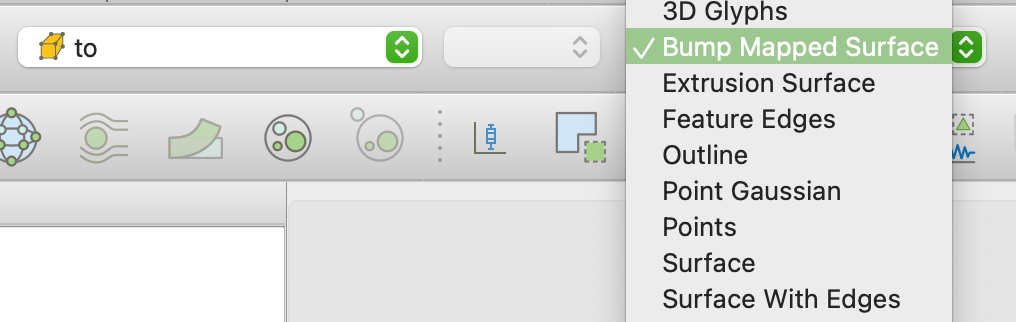
Once you have the embossing available as point data, with the color data passed through as cell data, and the plugin is active, you can chose to as variable for the color (choose the cell data version with the little box for a crisper image than with the point data version), and Bump Mapped Surface as rendering technique from the display menu on the top of the screen.
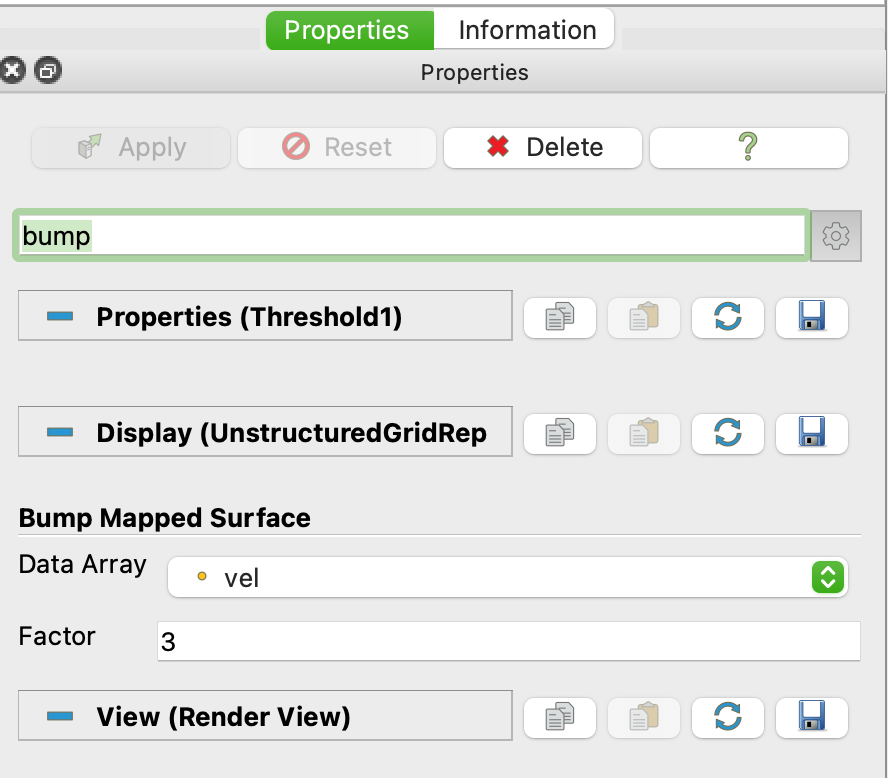
Use the search function of the Properties panel to search for bump and ensure that vel is chosen as variable. Use the Factor field to adjust the bumpyness to your liking.