PyNGL#
Note
PyNGL and PyNIO have been set to ‘maintenence mode’, which means that no further developments will be made. The focus of the development team is now on geocat-comp and geocat-viz.
NCAR/GEOCAT: November 2020 Update
https://geocat.ucar.edu/blog/2020/11/11/November-2020-update
The Python language module PyNGL (pronounced “pingle”) is used to visualize scientific data, with an emphasis on high quality 2D visualizations. It is based on the capabilities and functionality of NCL. In addition the PyNIO Python module is used for reading and writing files in several different data formats, including netCDF, netCDF 4, GRIB1, GRIB2, HDF 4, HDF-EOS 2 and HDF-EOS5, and CCM history files, similar to the NCL file input/output functionality.
PyNGL and PyNIO provide Python interfaces to most of the NCL functionality. A knowledge of NCL would give you a leg up in using these modules, but they are meant to be independent from NCL and used as a stand-alone suite of Python functions.
PyNGL/PyNIO is free available: http://www.pyngl.ucar.edu/index.shtml
Most examples use the PyNIO module to read/write data from/to a file independant of the file type but in the future we will use xarray to read NetCDF files, ECMWF’s cfgrib to read GRIB files, and pyshp to read shapefiles.
How to use the example scripts at DKRZ#
Copy the example script you want to use to your work space. Not all example data sets are available but most files are stored in
/work/kv0653/NCL/data_examples
Note
PyNio works with Python 2 only. On Mistral you have to load the python module first.
Python 2.7
module load python/2.7-ve0
If you use Python 3 you should use xarray instead of PyNio.
Python 3.x
module load python3/unstable
Modify and execute the script:
python <script name>
For example
python PyNGL_unstructured_ICON_triangles.py
Note
DKRZ has created a GitHub Python repository named PyEarthScience that contains Visualization, Analysis and IO example scripts. The sense of the repository is to establish a kind of a platform for Earth scientists for searching and representing Python scripts and packages using PyNGL/PYNIO, matplotlib, cartopy, xarray etc. The repository is still in progress. KMFleischer/PyEarthScience
Categories#
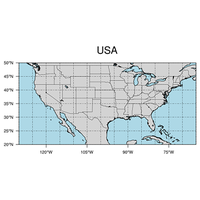
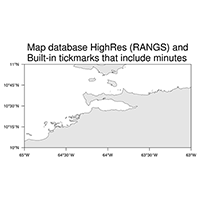
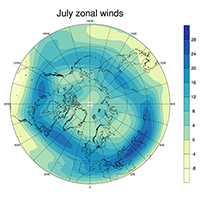
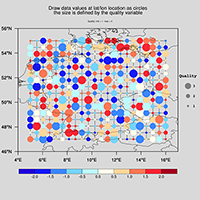
map resources, functions, sub-regions |
|
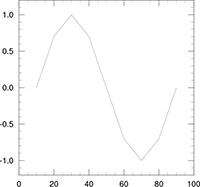
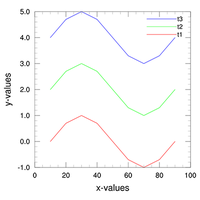
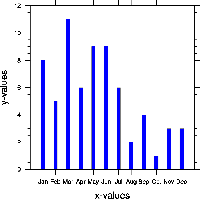
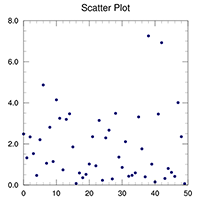
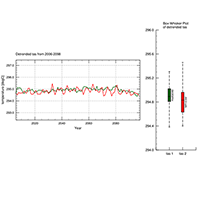
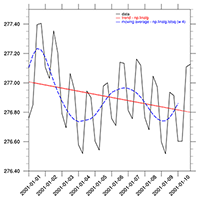
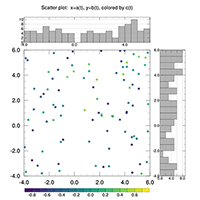
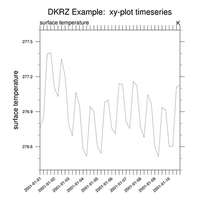
1D data line plots, timeseries, scatter plots, statistics |
|
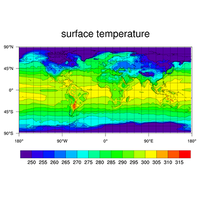
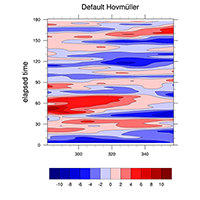
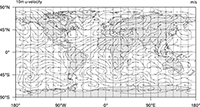
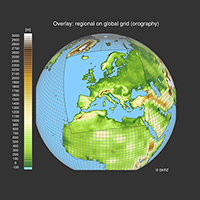
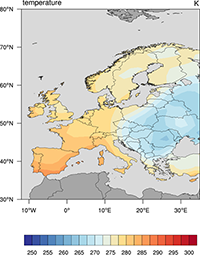
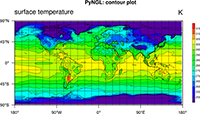
2D data line, color fill (shaded), fill pattern, overlays |
|
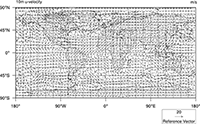
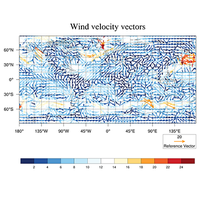
2D vector data, e.g. wind components uv |
|
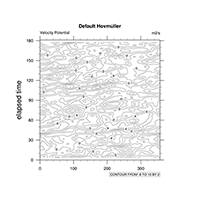
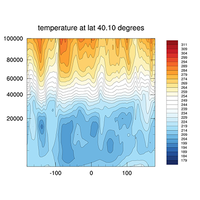
contour plot of a vertical slice |
|
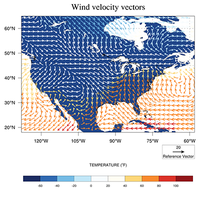
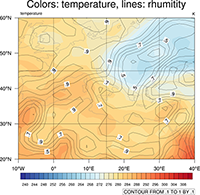
contour line on filled contour plot, vector on contours, different grid resolutions |
|
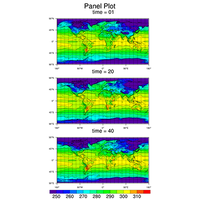
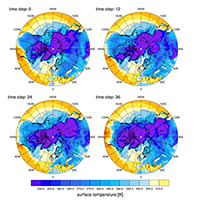
multiple plots in one frame (page) |
|
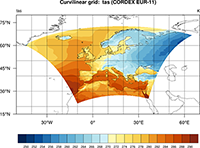
rectilinear, curvilinear, unstructured grids |
|
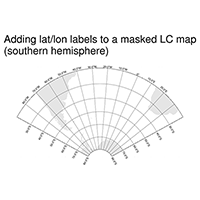
some special plots |
|
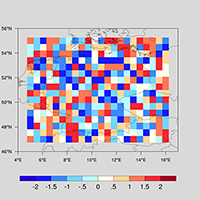
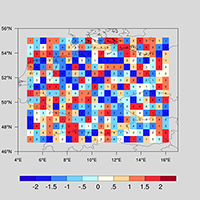
mask the data |
|
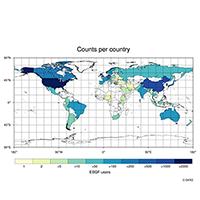
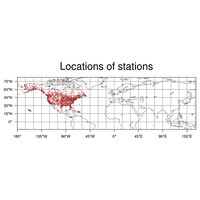
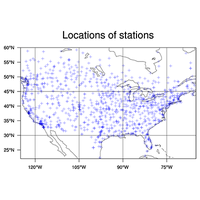
country outlines, compute temperature means of counties |
|
regrid curvilinear to rectilinear, regrid to higher resolution |
|
example scripts using xarray to read data files |
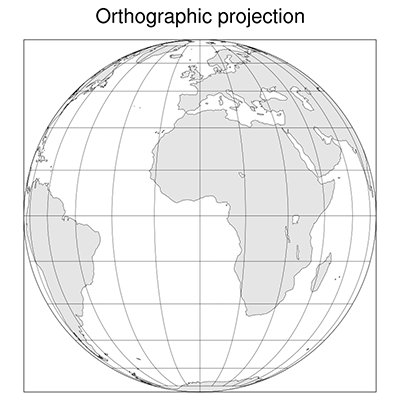
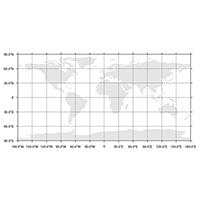
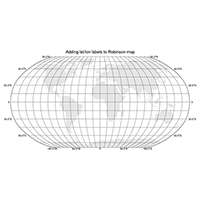
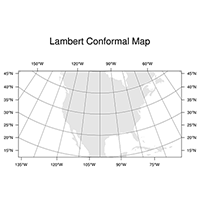
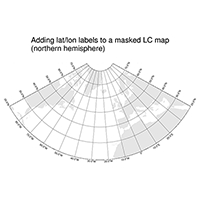
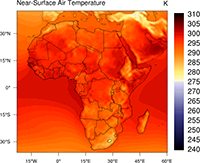
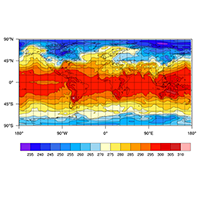
Maps#
|
||
|