Python#
The standard module for visualization in Python is Matplotlib. Matplotlib is a Python 2D plotting library which produces publication quality figures in a variety of hardcopy formats and interactive environments across platforms.
Matplotlib can be used in Python scripts, the Python and iPython shell (ala MATLAB®* or Mathematica®†), web application servers, and six graphical user interface toolkits.
Matplotlib is free available: http://matplotlib.org/
For Python 3 Cartopy (https://pypi.org/project/Cartopy/), a cartographic python library with Matplotlib support for visualization, is used instead of Basemap.
How to use the example scripts at DKRZ#
On Levante you have to load the python3 module first:
module load python3
The module python3 includes the Matplotlib and Cartopy packages already.
Copy the example script you want to use to your work space. Not all example data sets are available but most files are stored in the folder
/work/kv0653/Python/data
Modify and execute the script:
python <script name>
For example
python matplotlib_contour_filled.py
Note
DKRZ has created a GitHub Python repository named PyEarthScience that contains Visualization, Analysis and IO example scripts. The sence of the repository is to establish a kind of a platform for Earth scientists for searching and representing Python scripts, tutorials, and packages using PyNGL/PYNIO, Matplotlib, Cartopy, Xarray, etc.
Categories#
map resources, functions, sub-regions |
|
1D data line plots, timeseries, scatter plots, statistics |
|
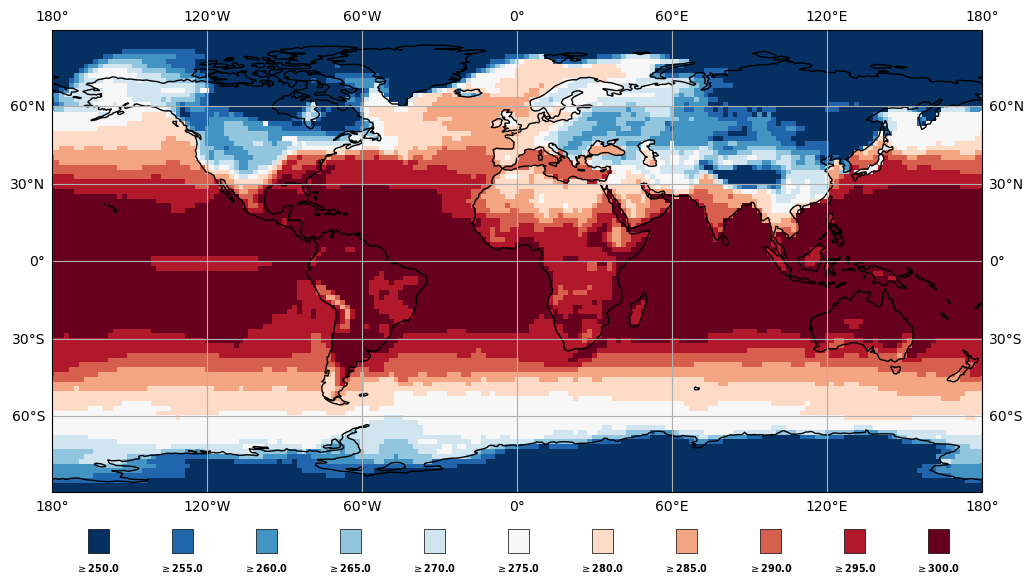
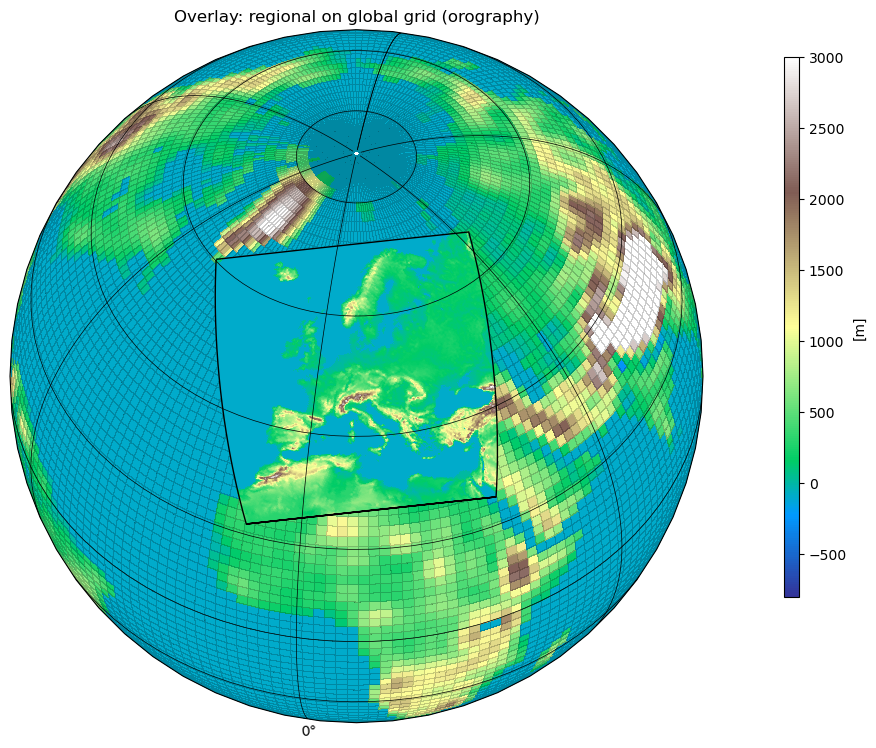
2D data line, color fill (shaded), fill pattern, overlays |
|
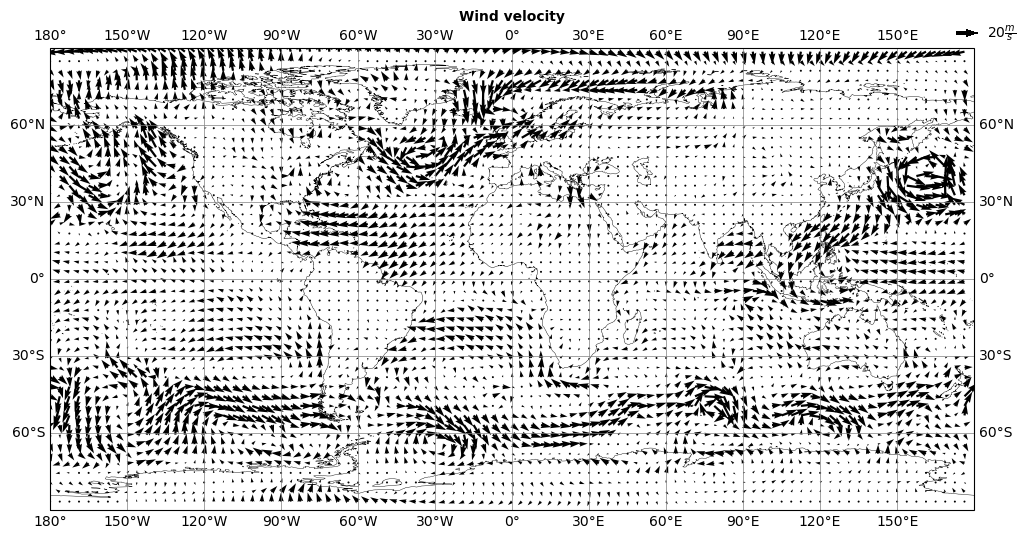
2D vector data, e.g. wind components uv |
|
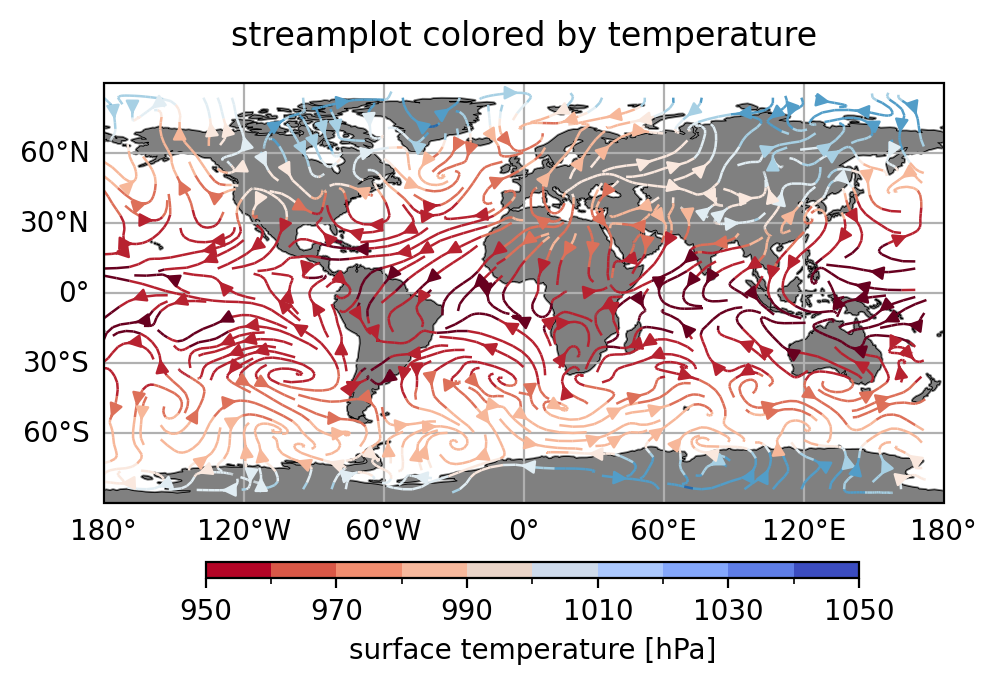
Streamlines |
|
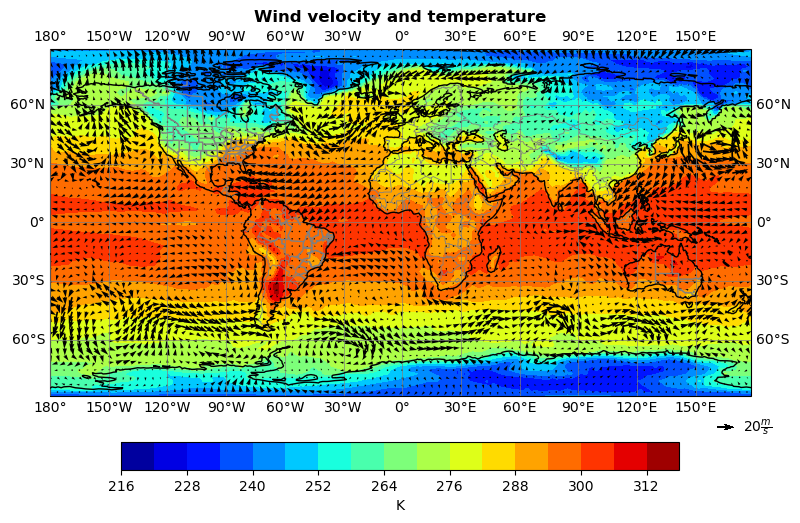
contour line on filled contour plot, vector on contours, different grid resolutions |
|
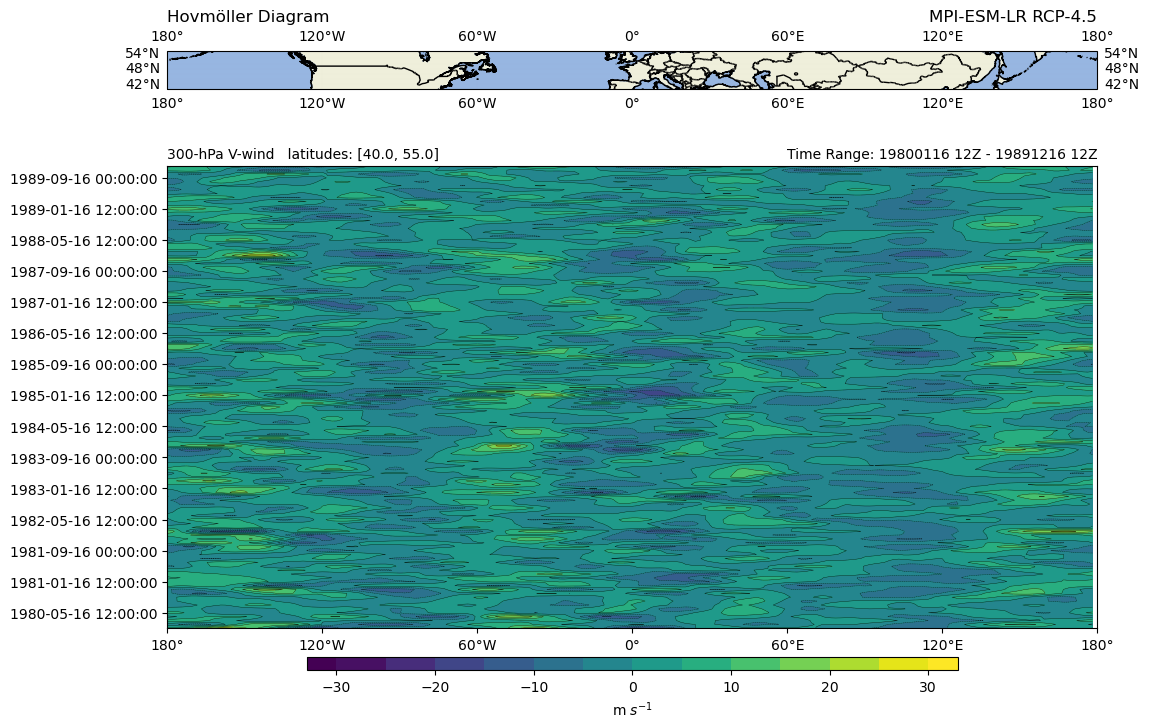
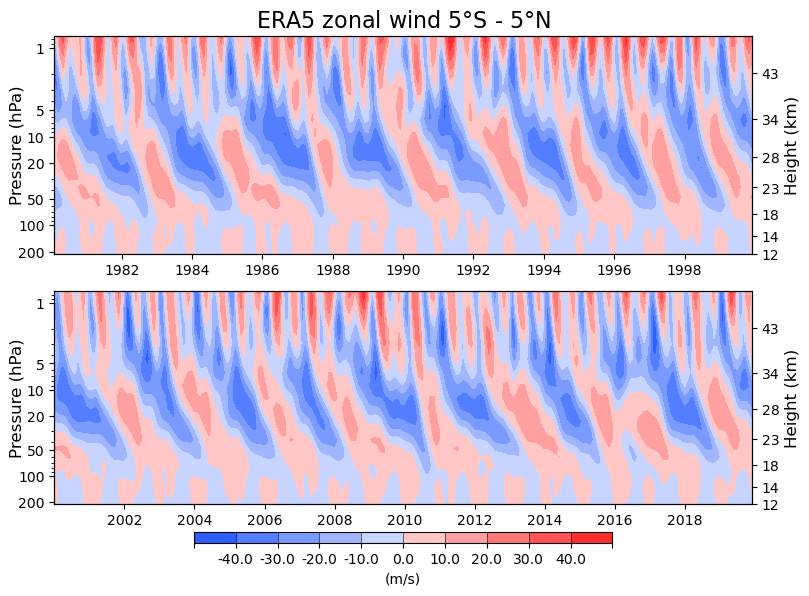
draw contours longitudes/latitudes against time |
|
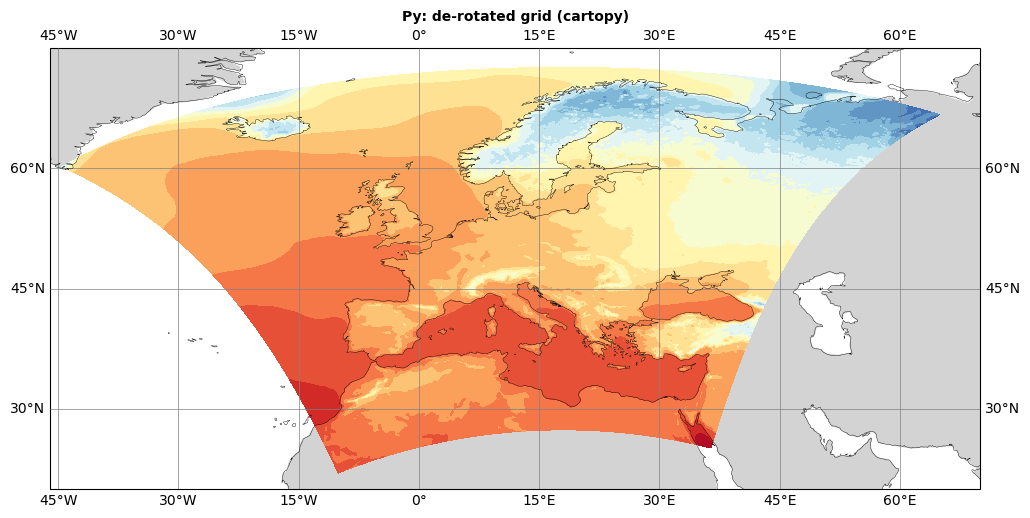
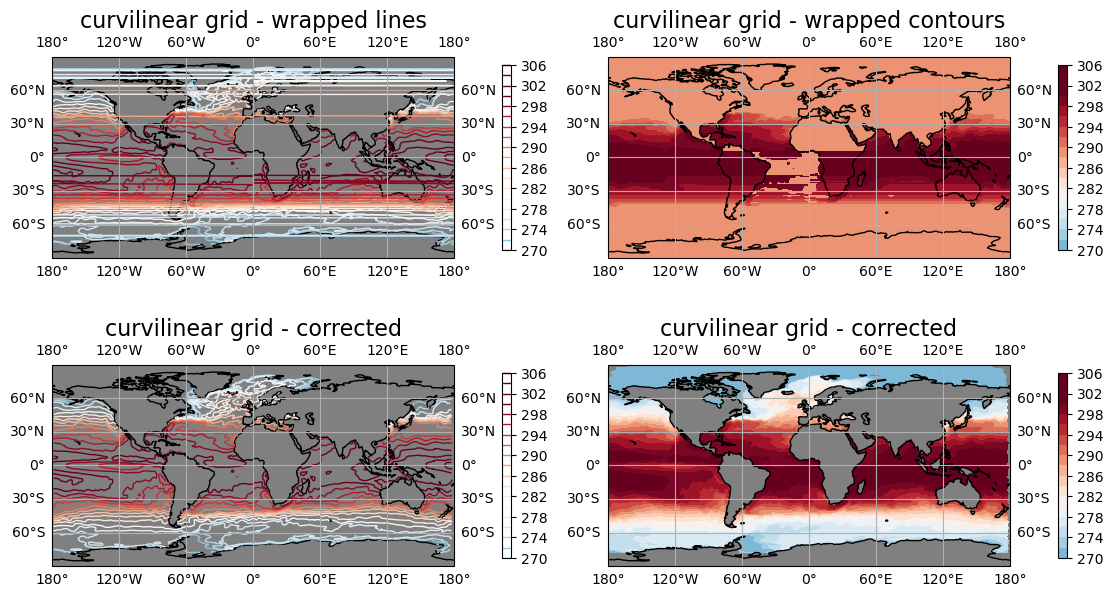
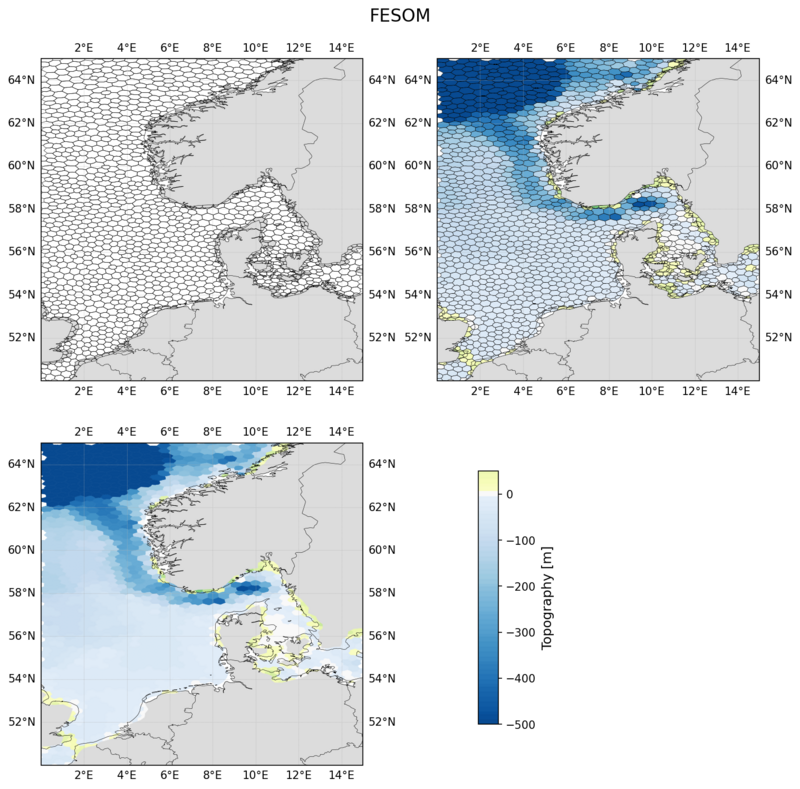
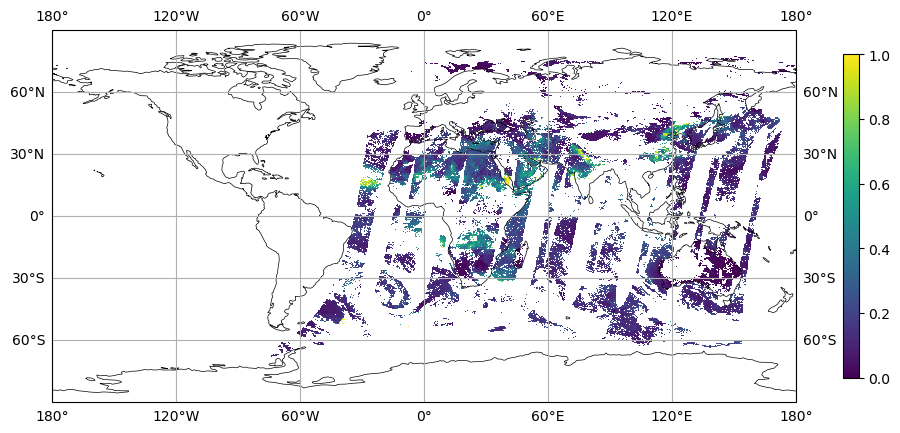
rectilinear, curvilinear, unstructured grids |
|
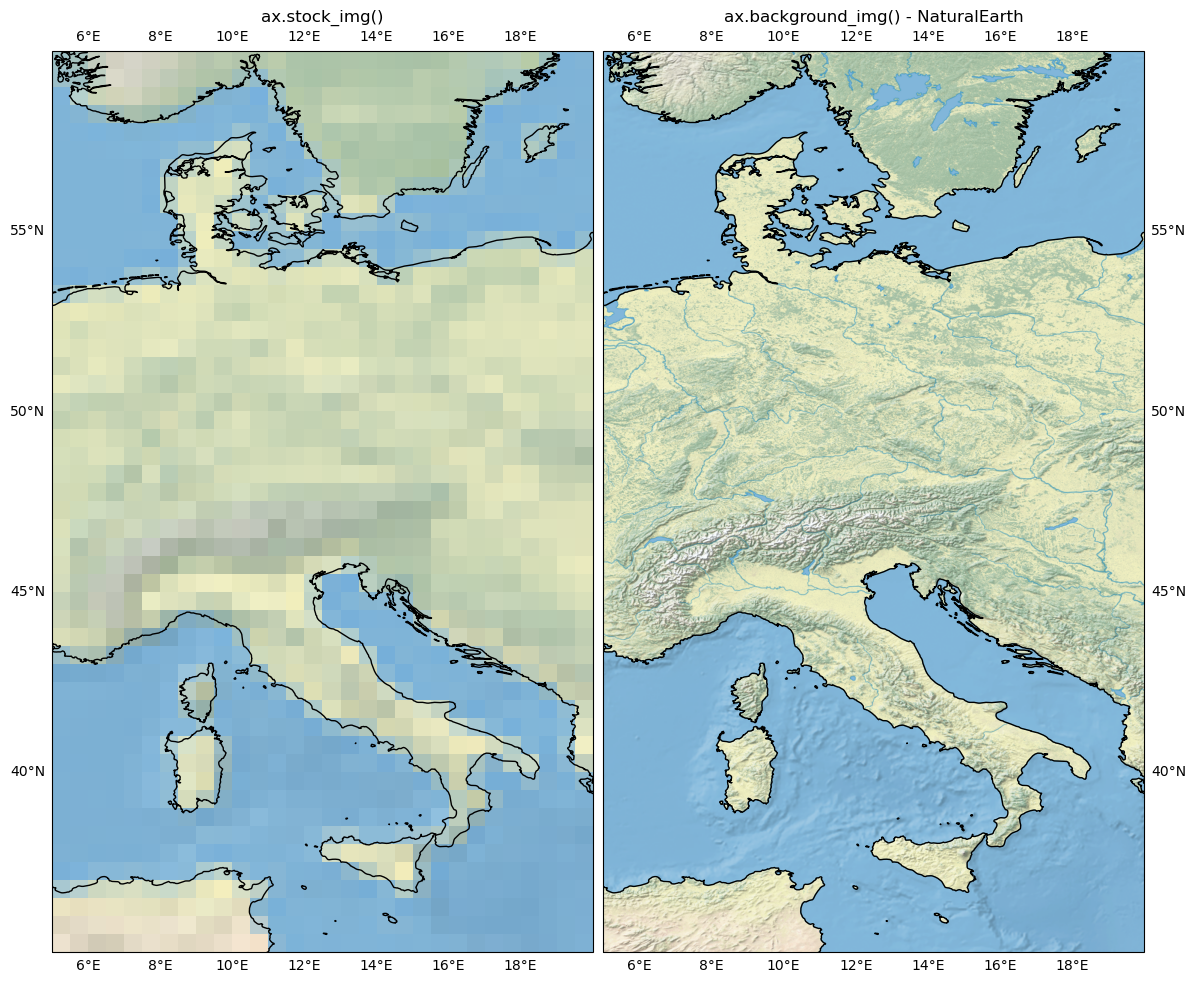
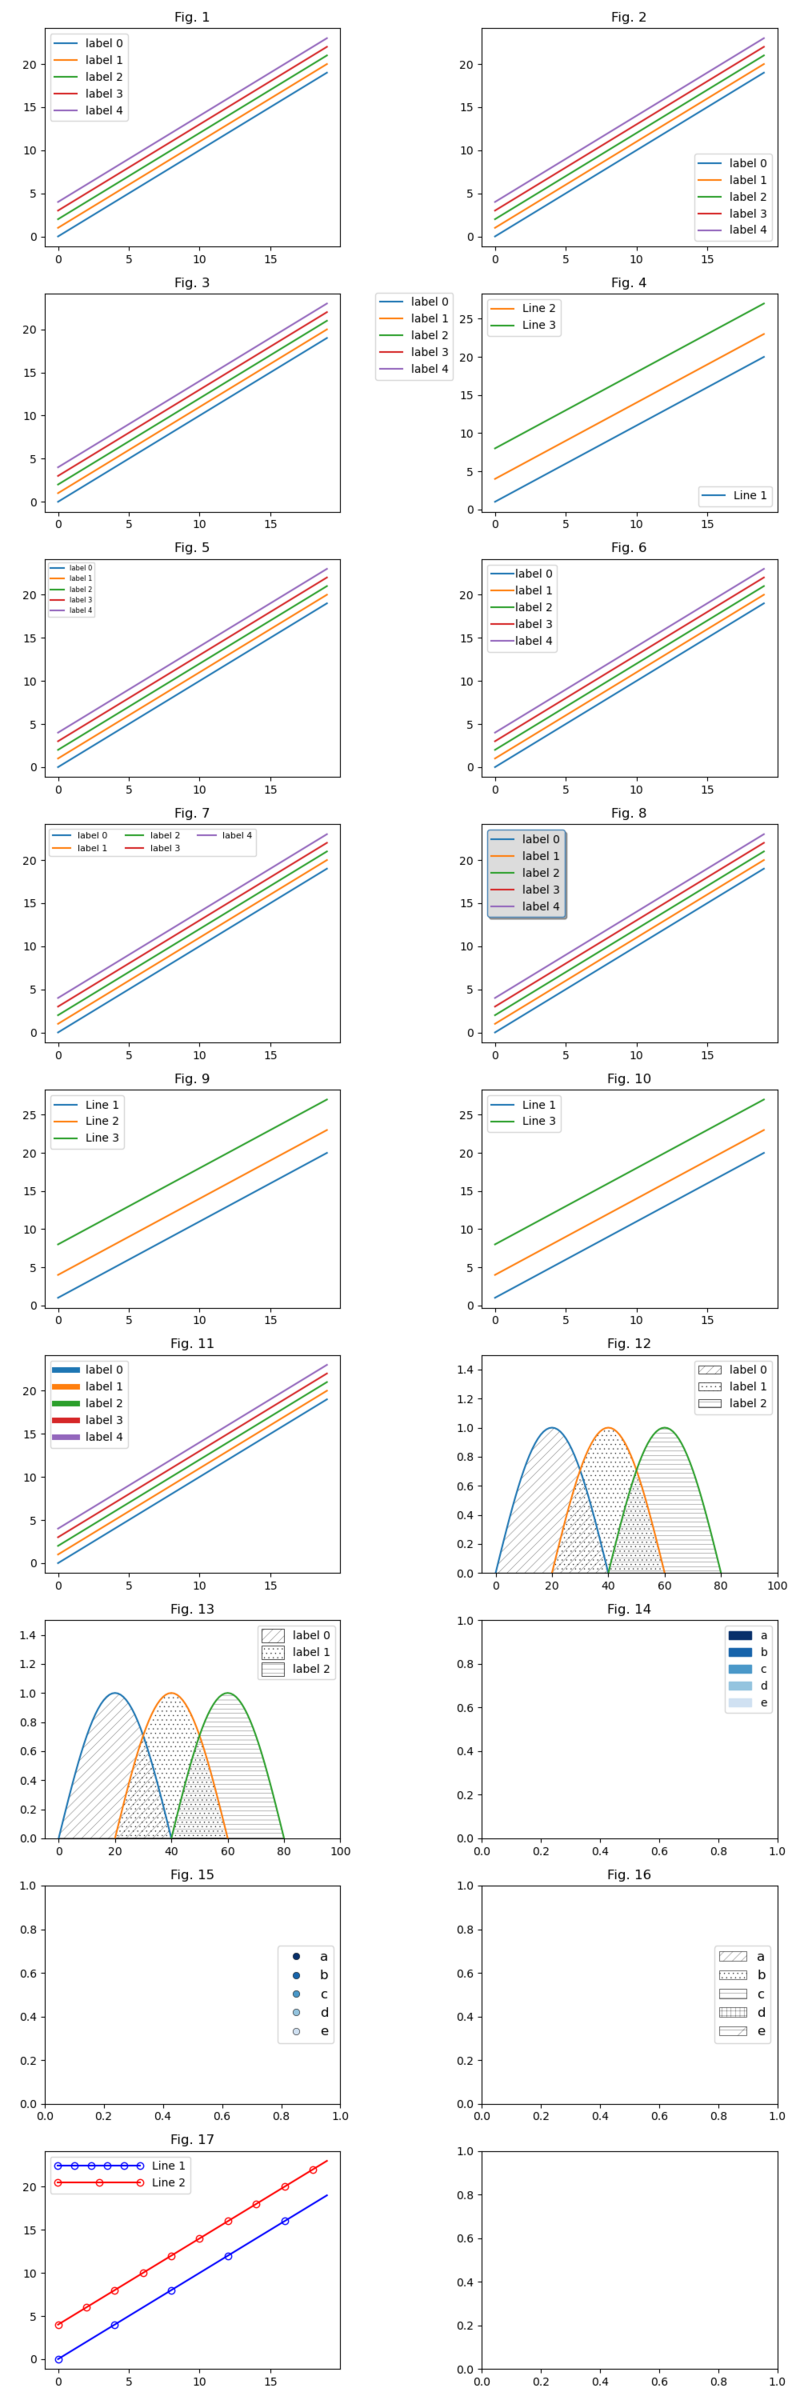
about Matplotlib axes |
|
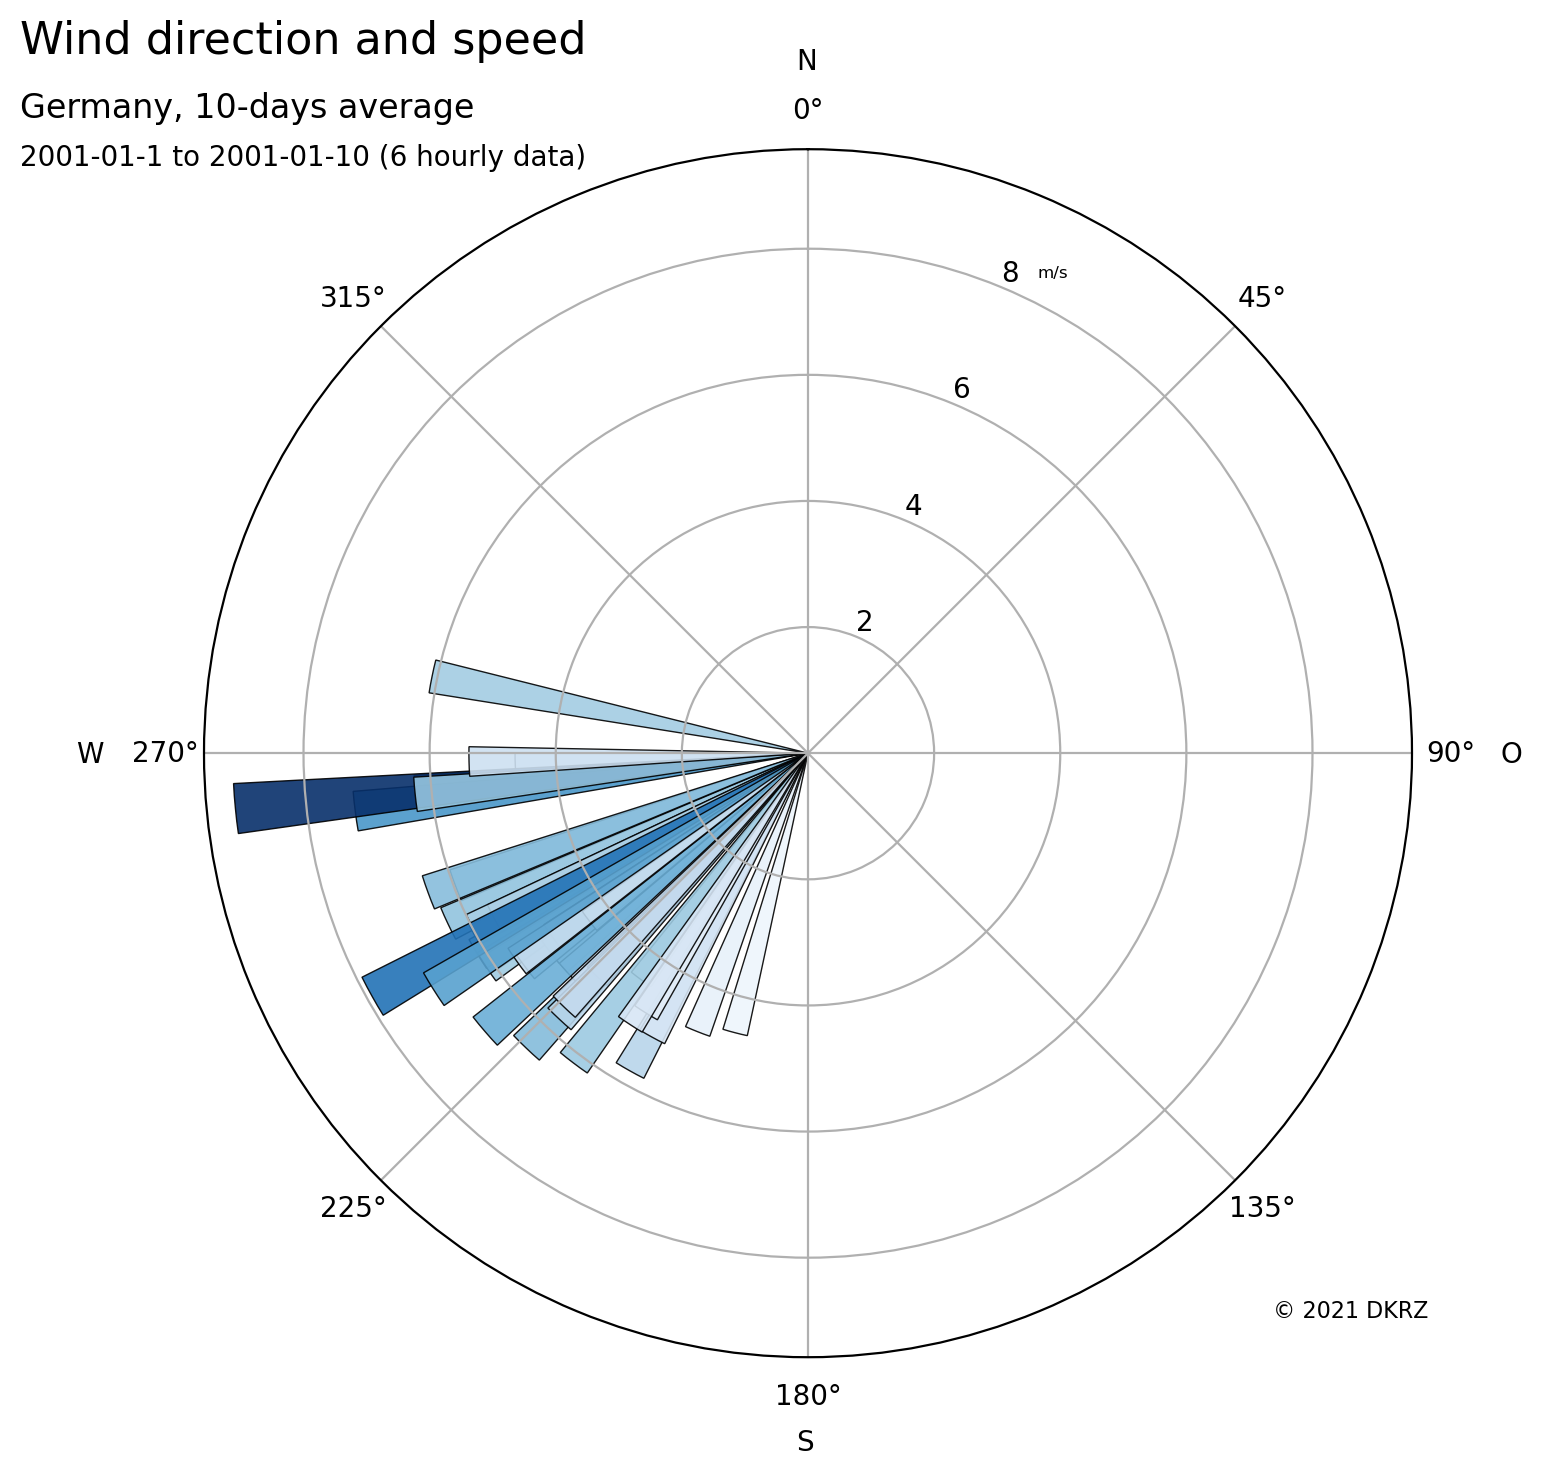
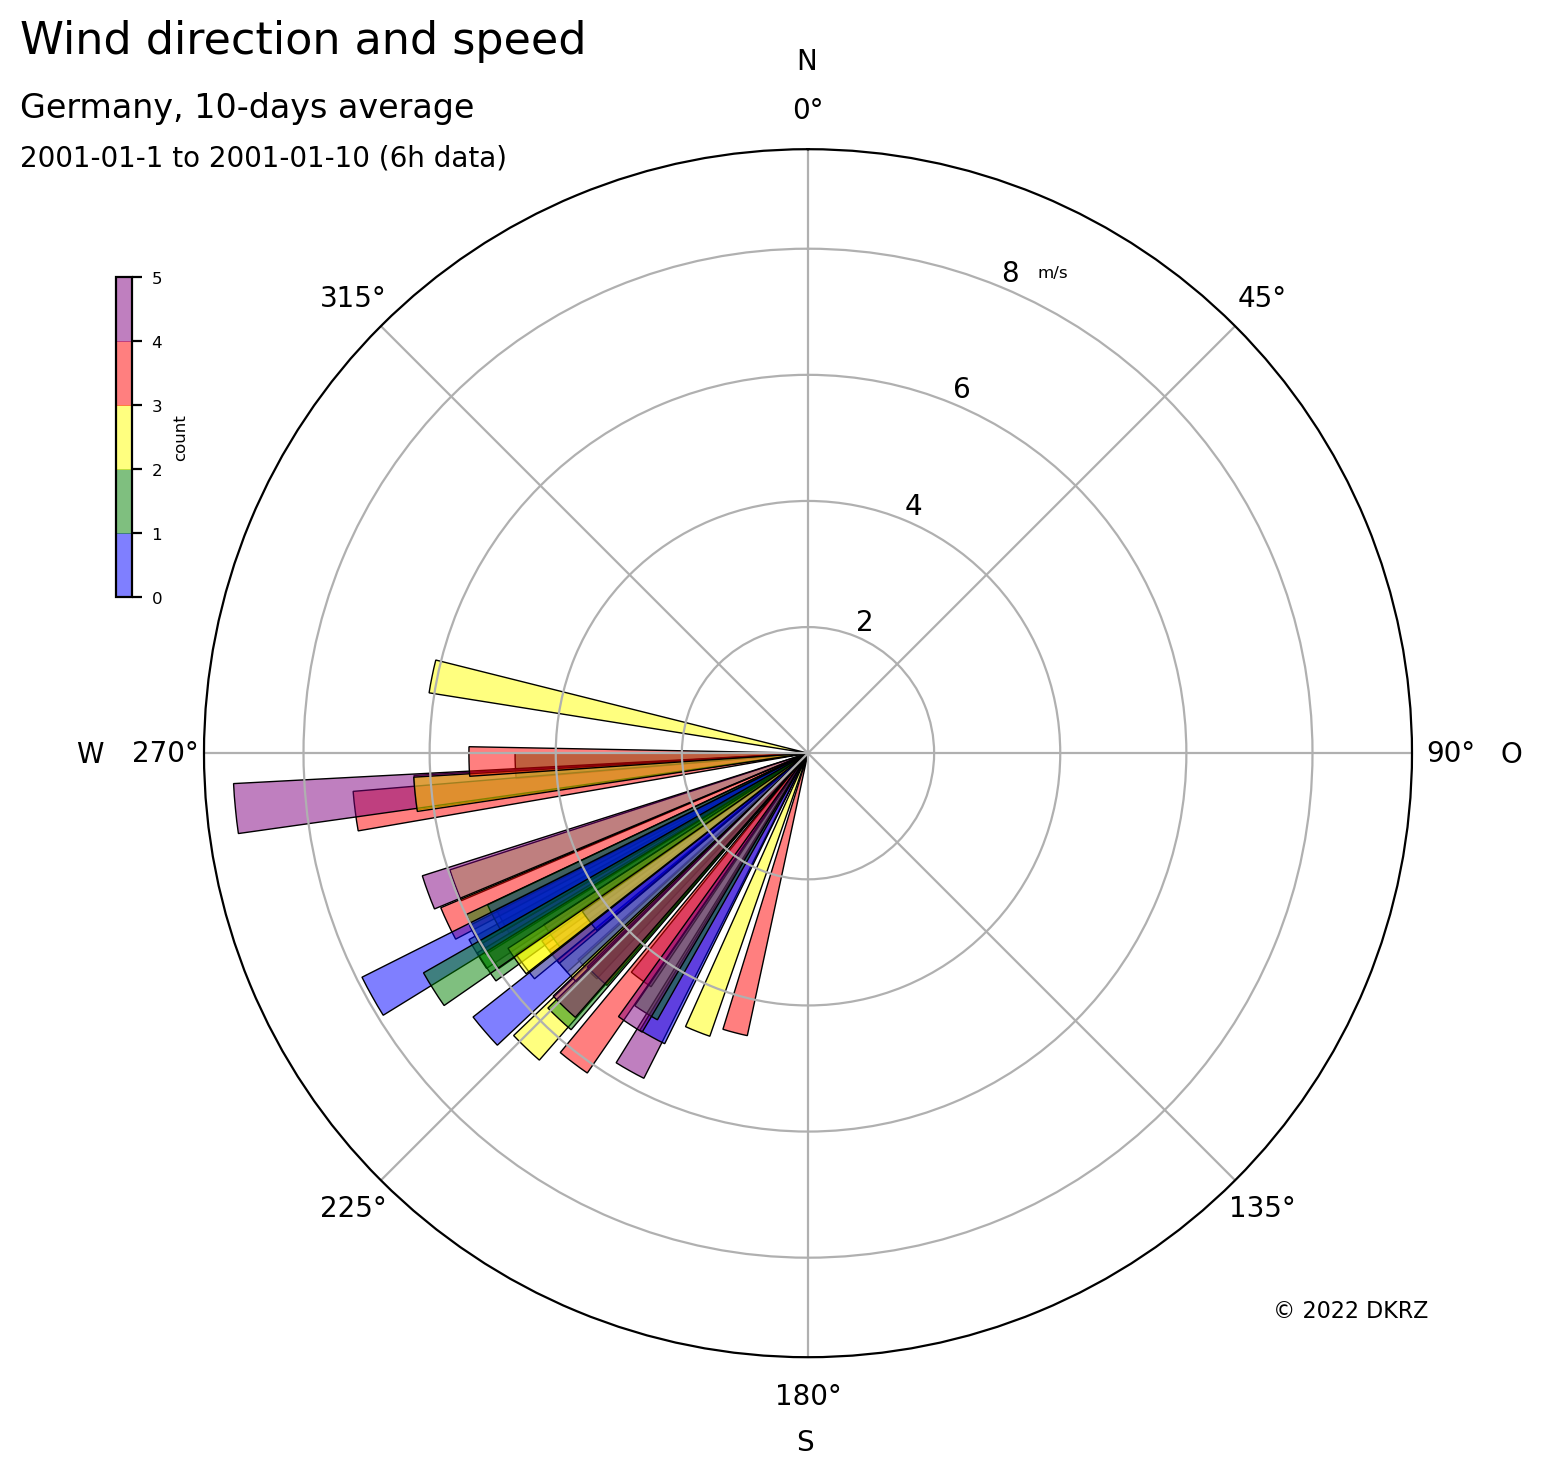
miscellaneous plots |
|
work with shapefiles |
|
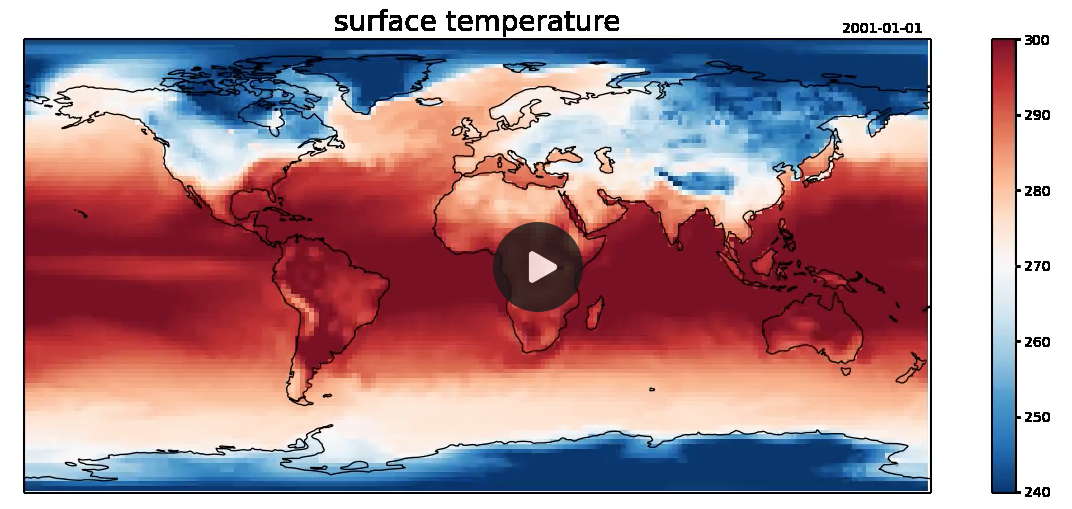
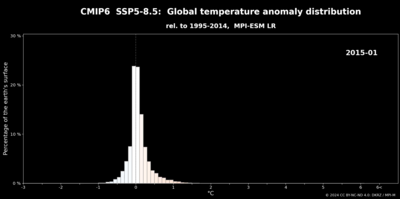
scripts to generate animations |
|
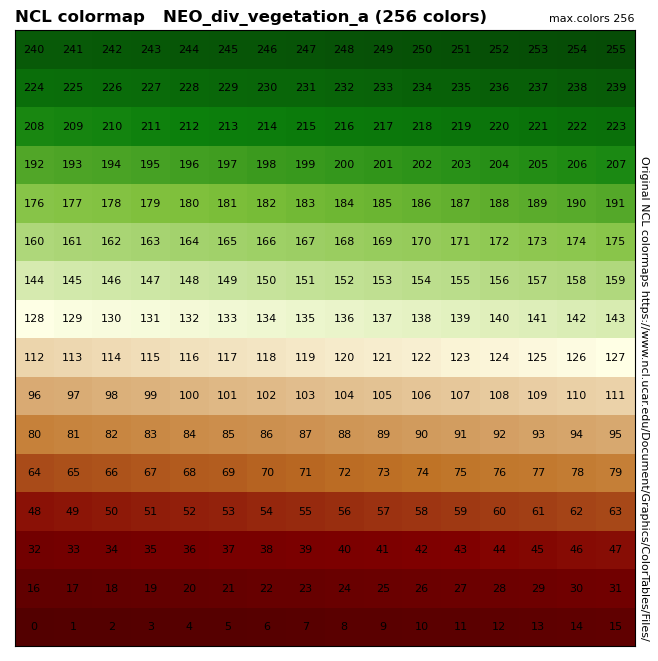
some specials about colors |
|
use of pyvista, geovista, … |
|
auxiliary scripts |
|
functions translated to Python |
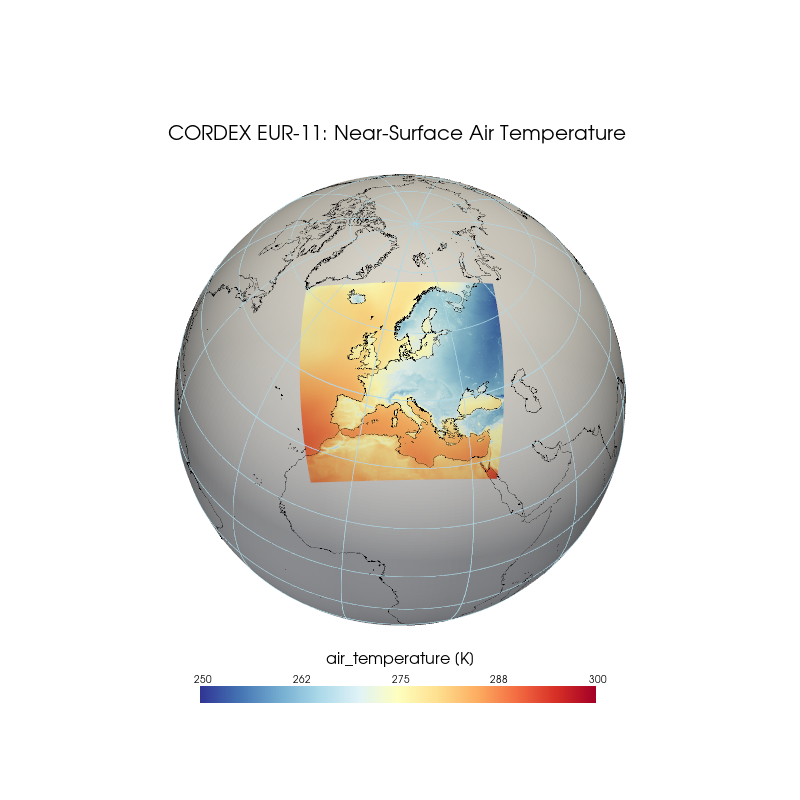
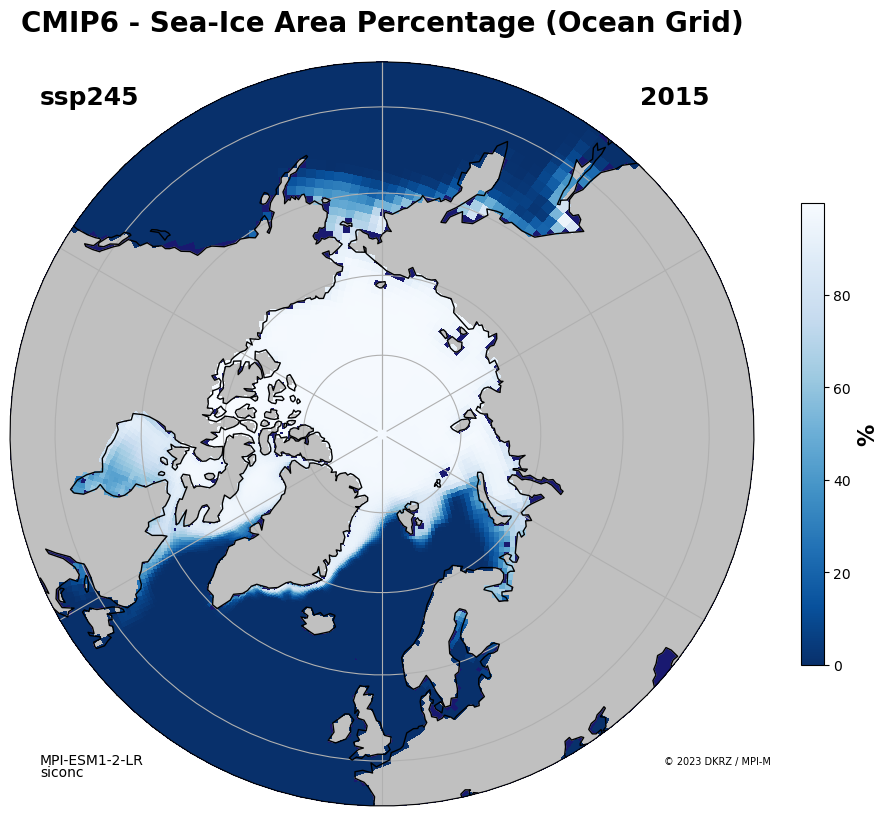
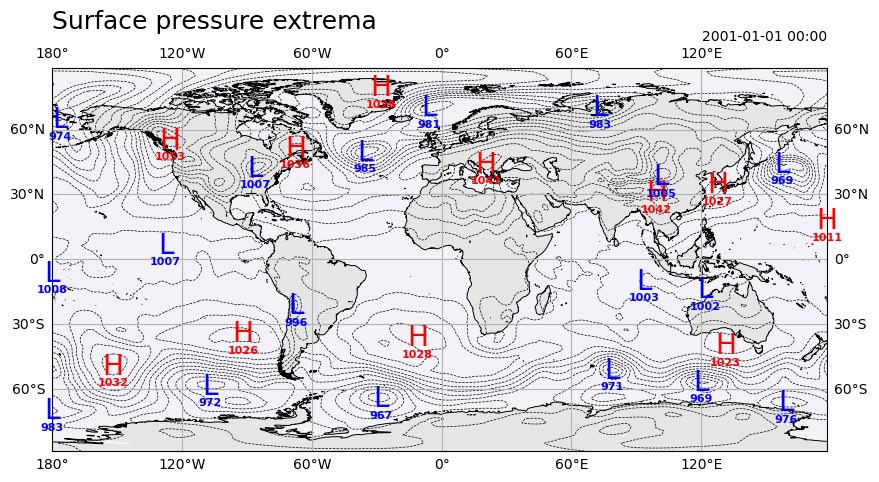
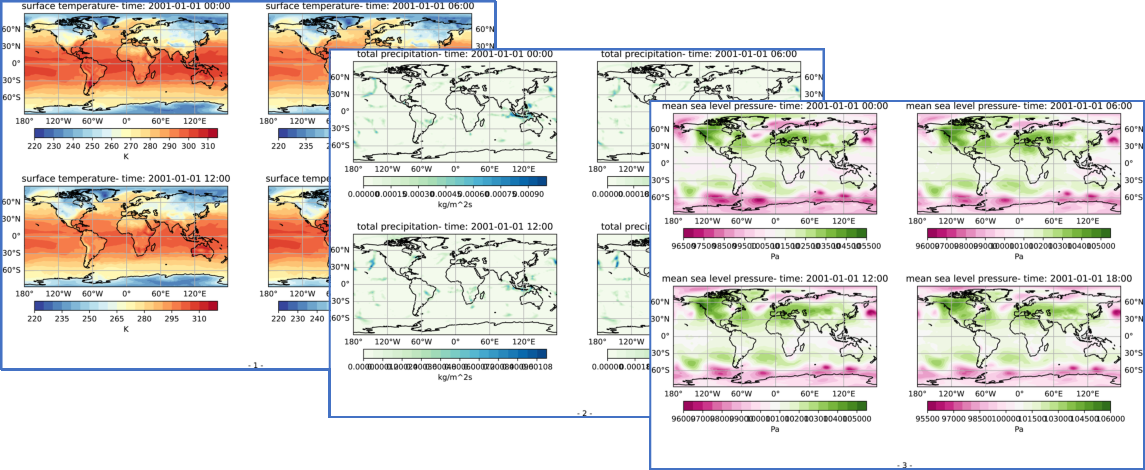
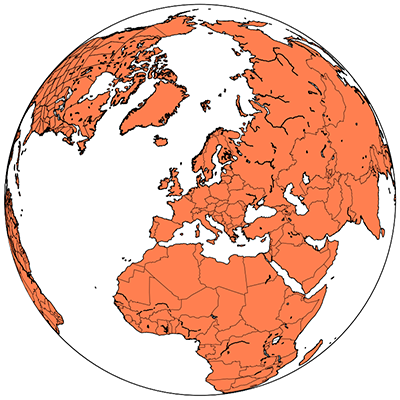
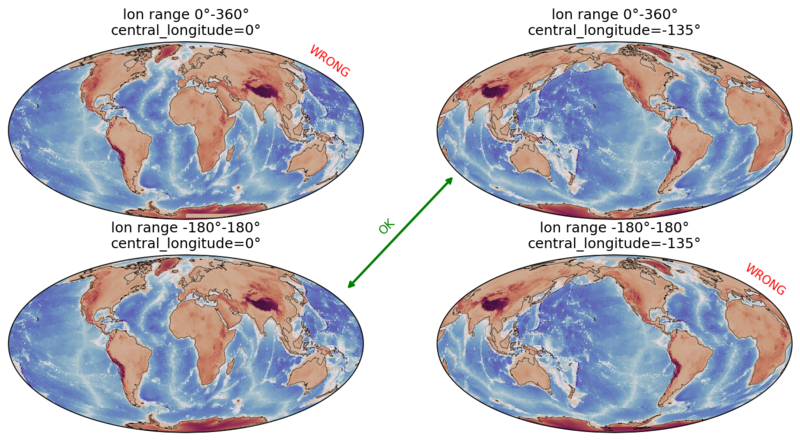
Maps#

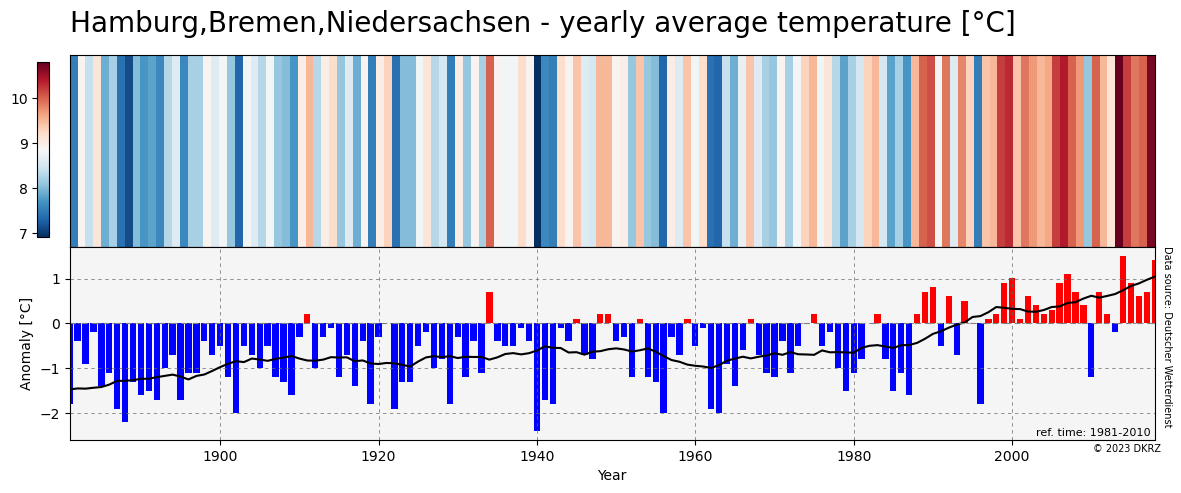
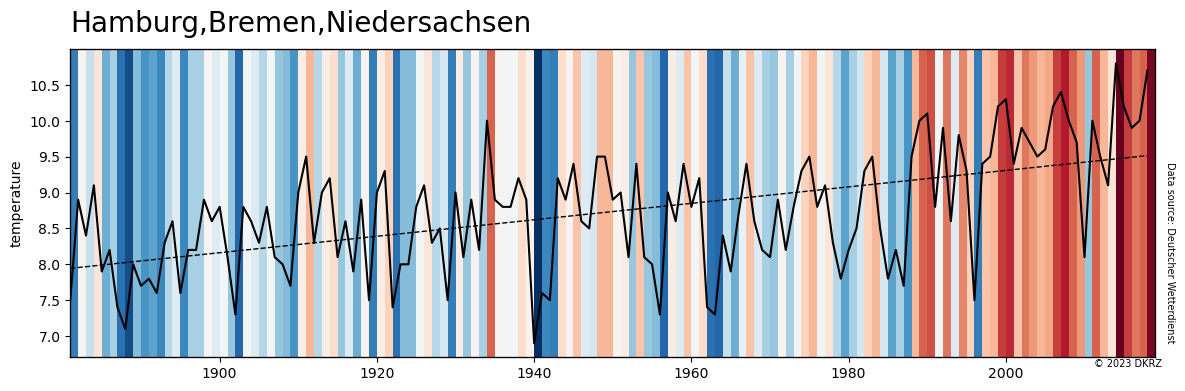
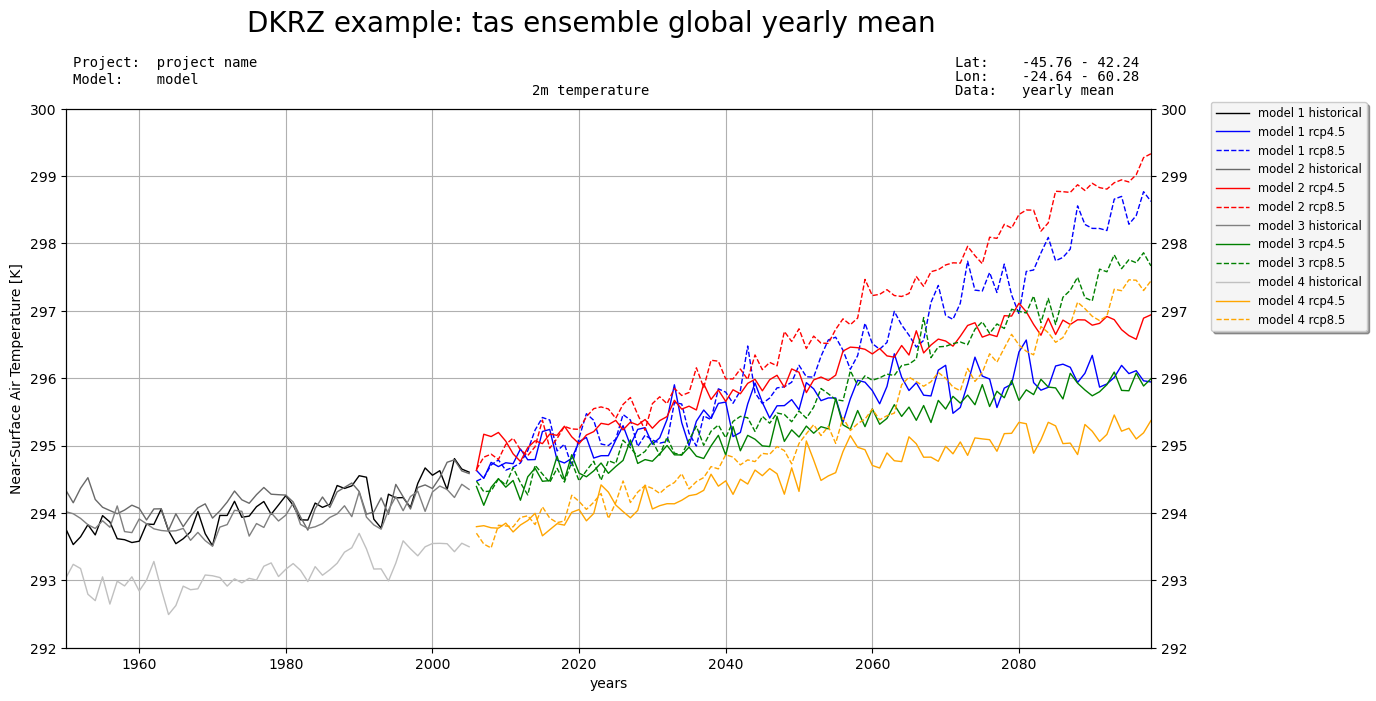
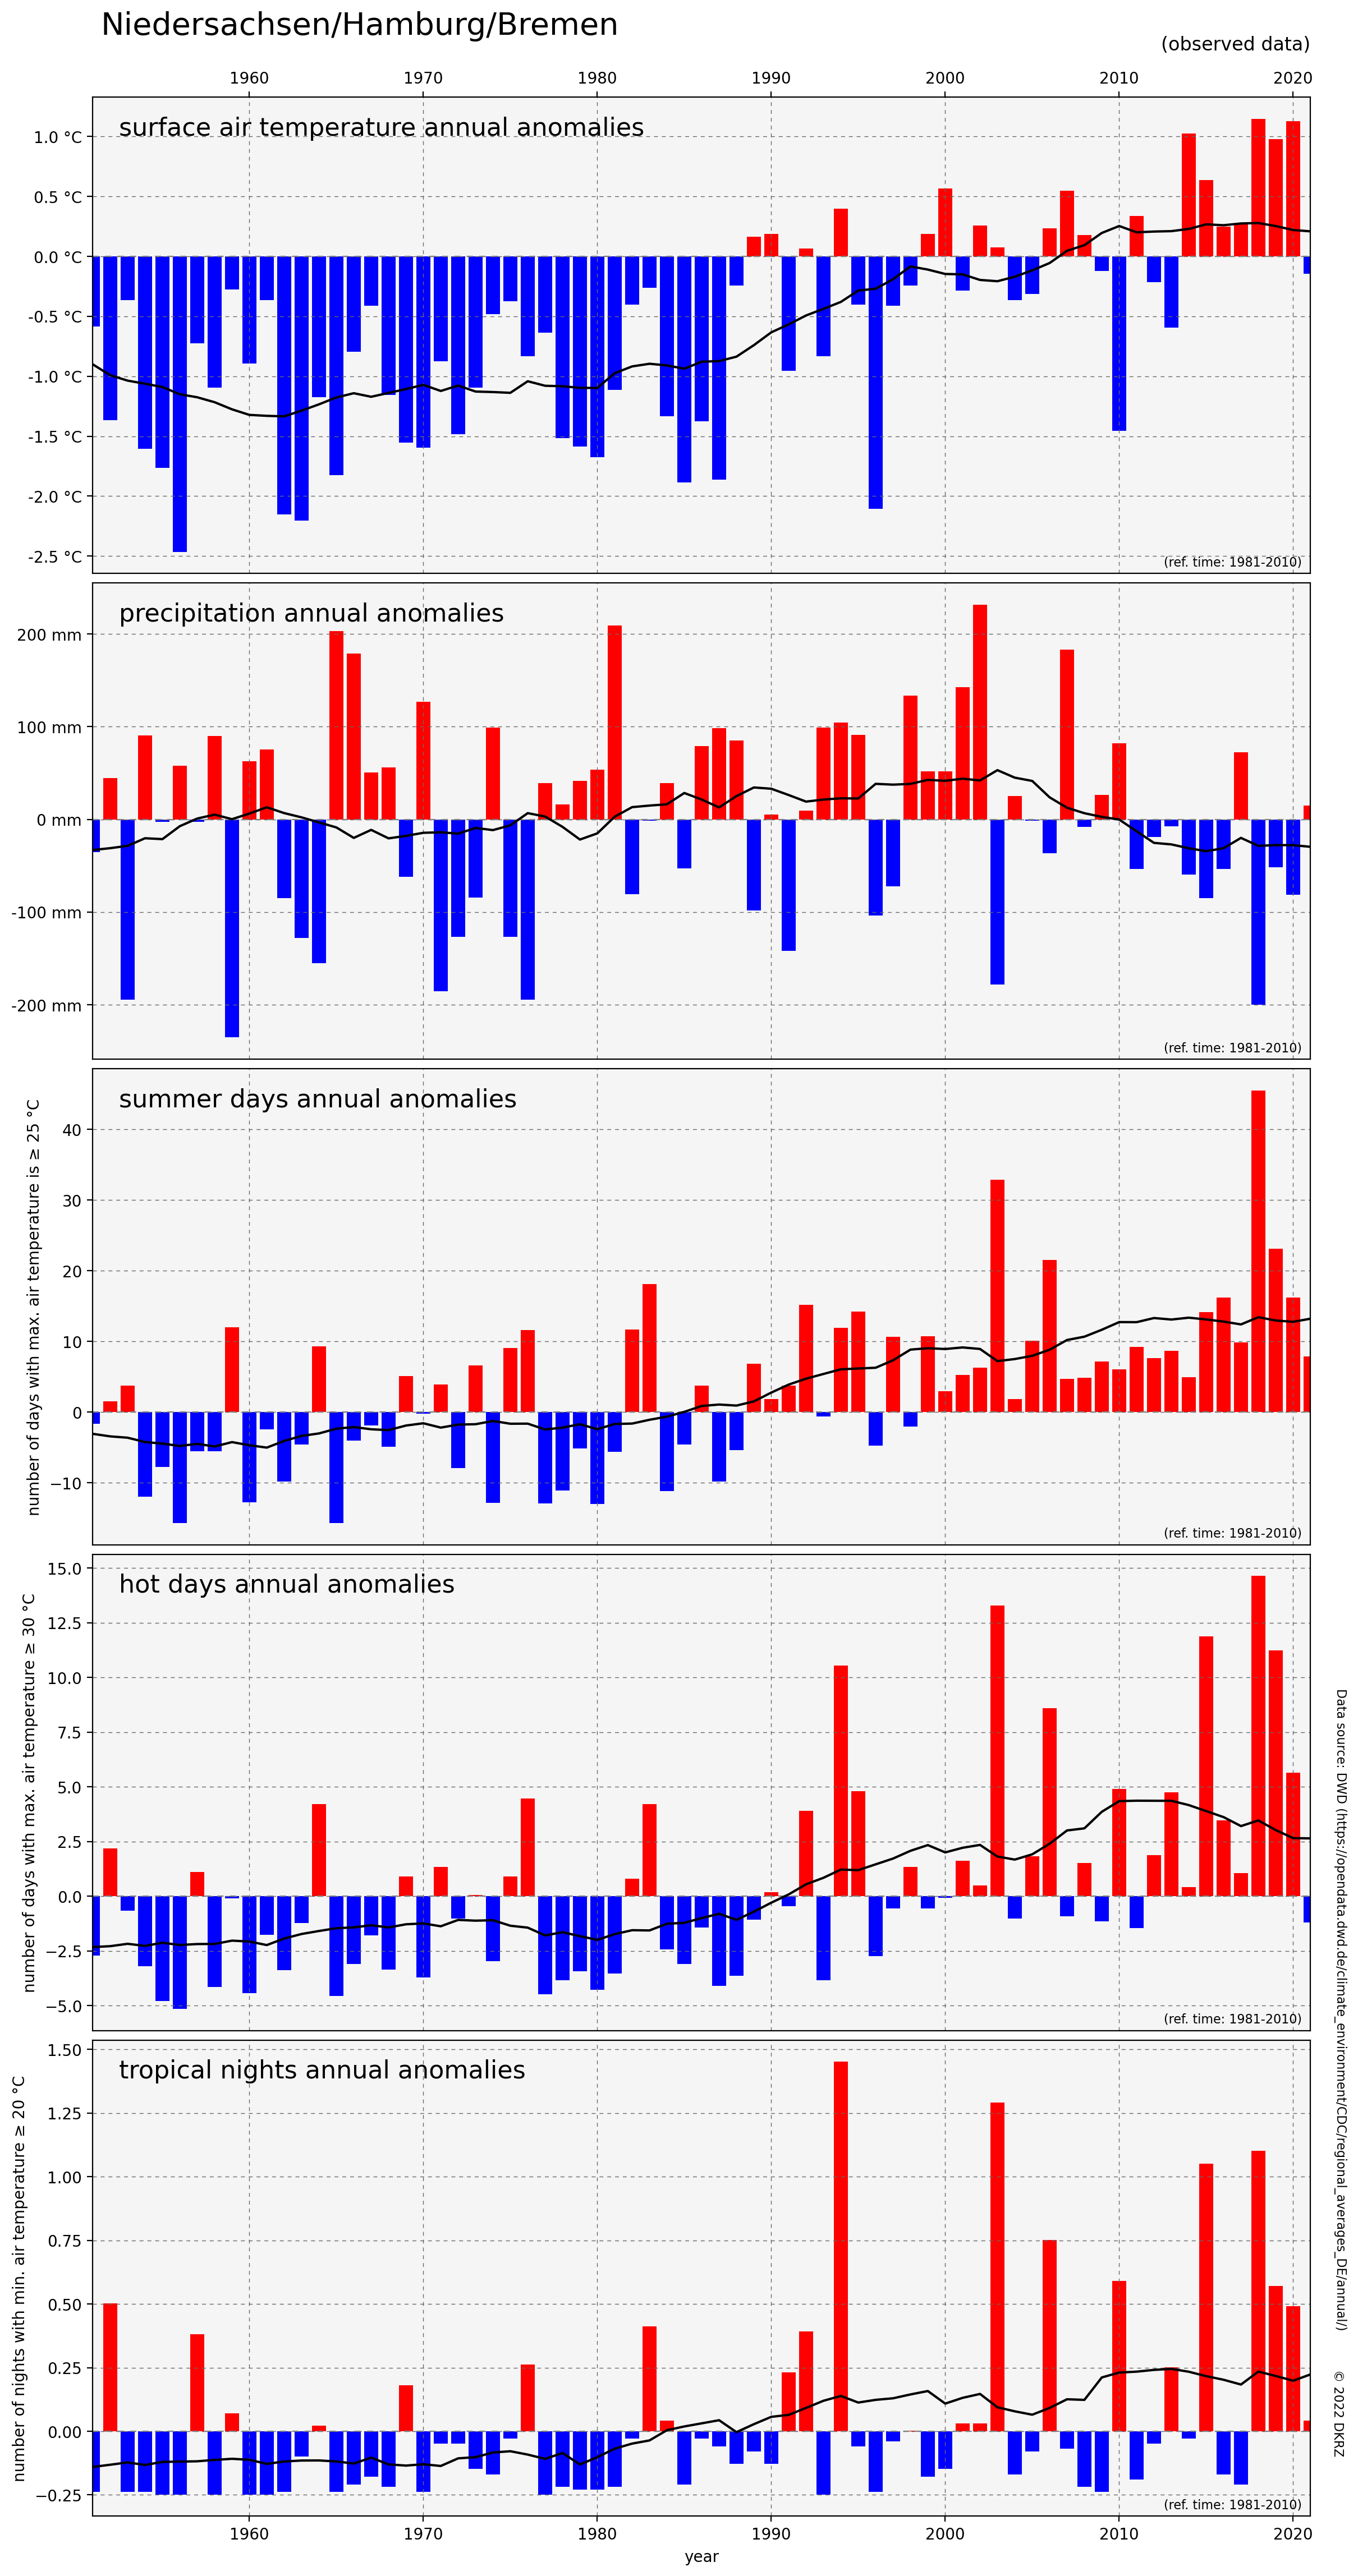
XY-plots#

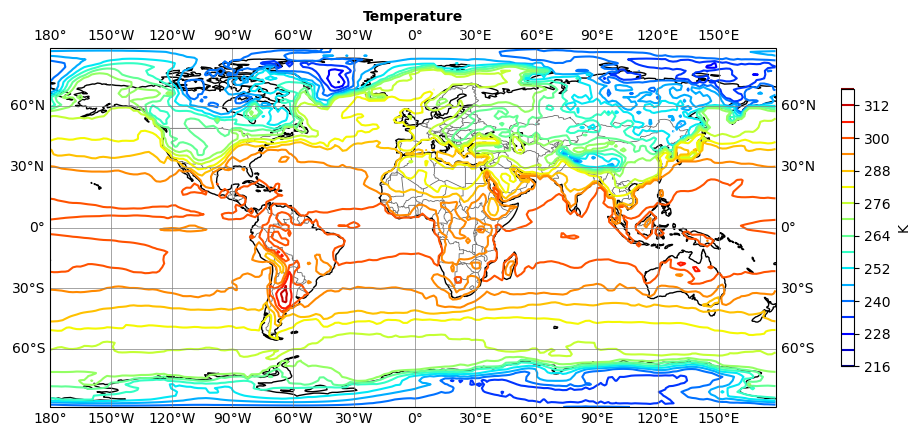
Contours#
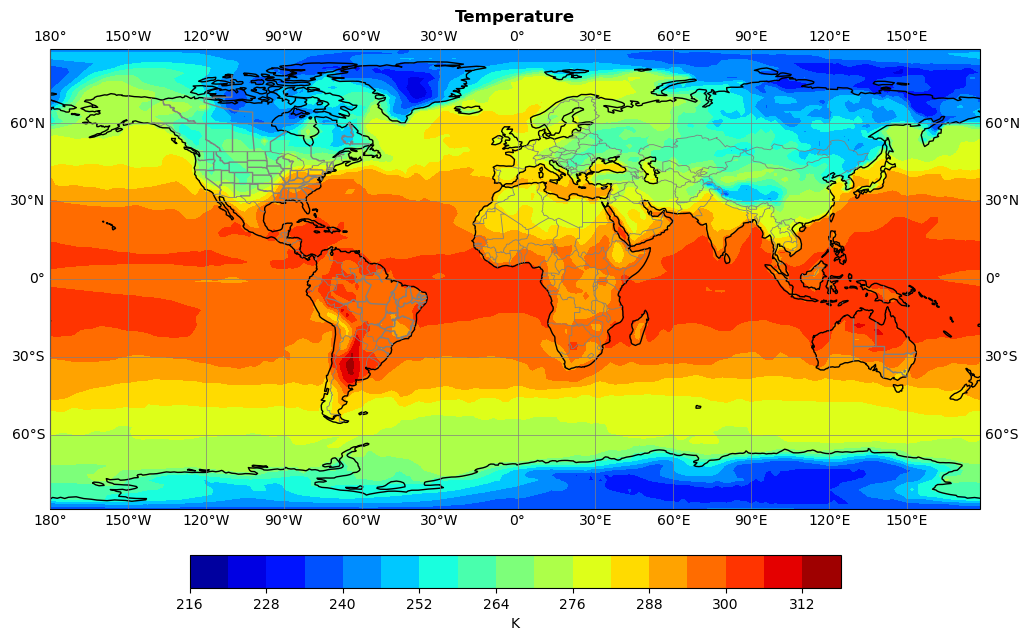

Vectors#
Streamlines#
Overlays#
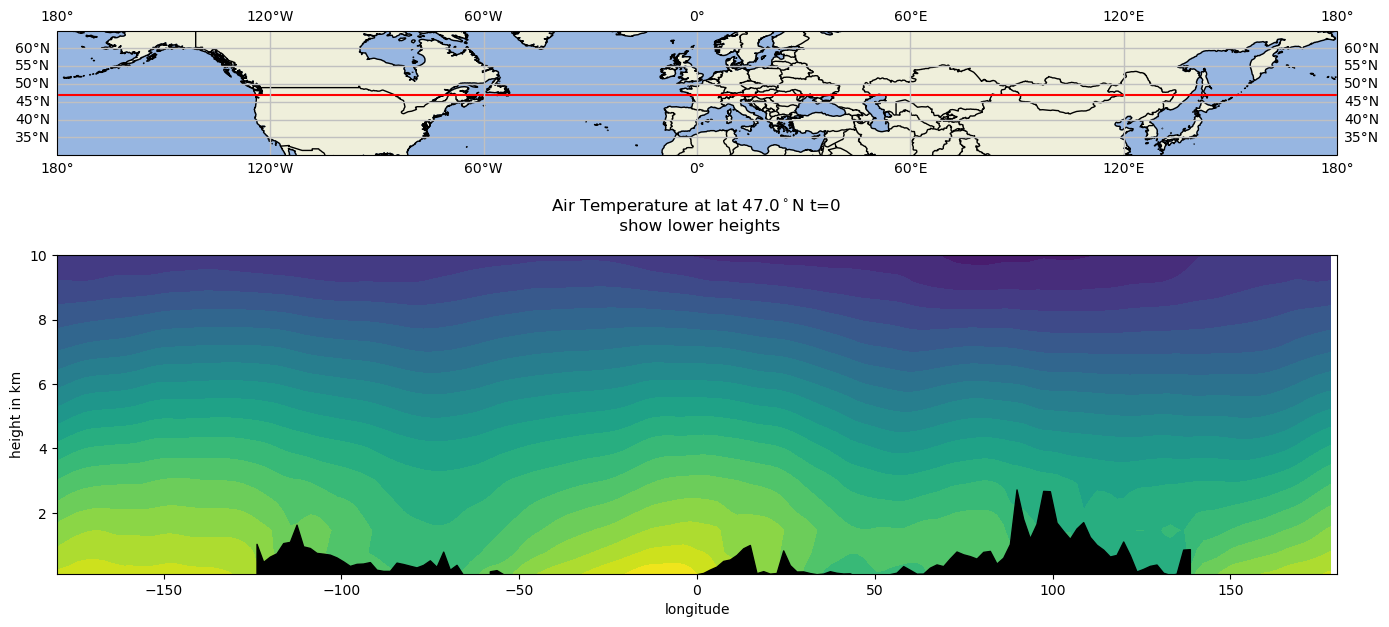
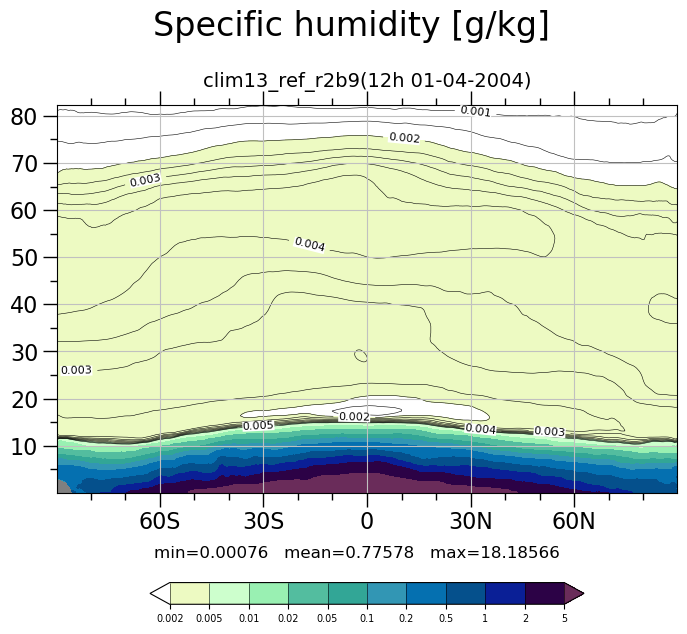
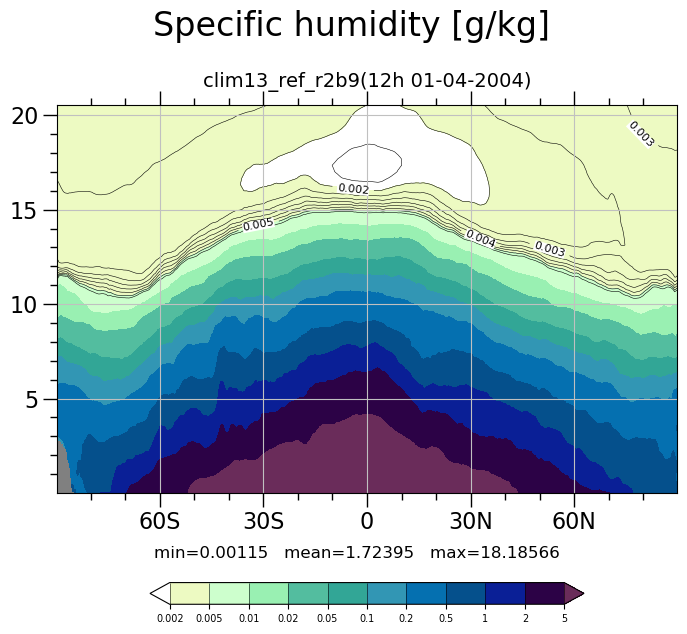
Slices#
Grids#
|
|
|
|
|
|
|
|
|
|
|
|