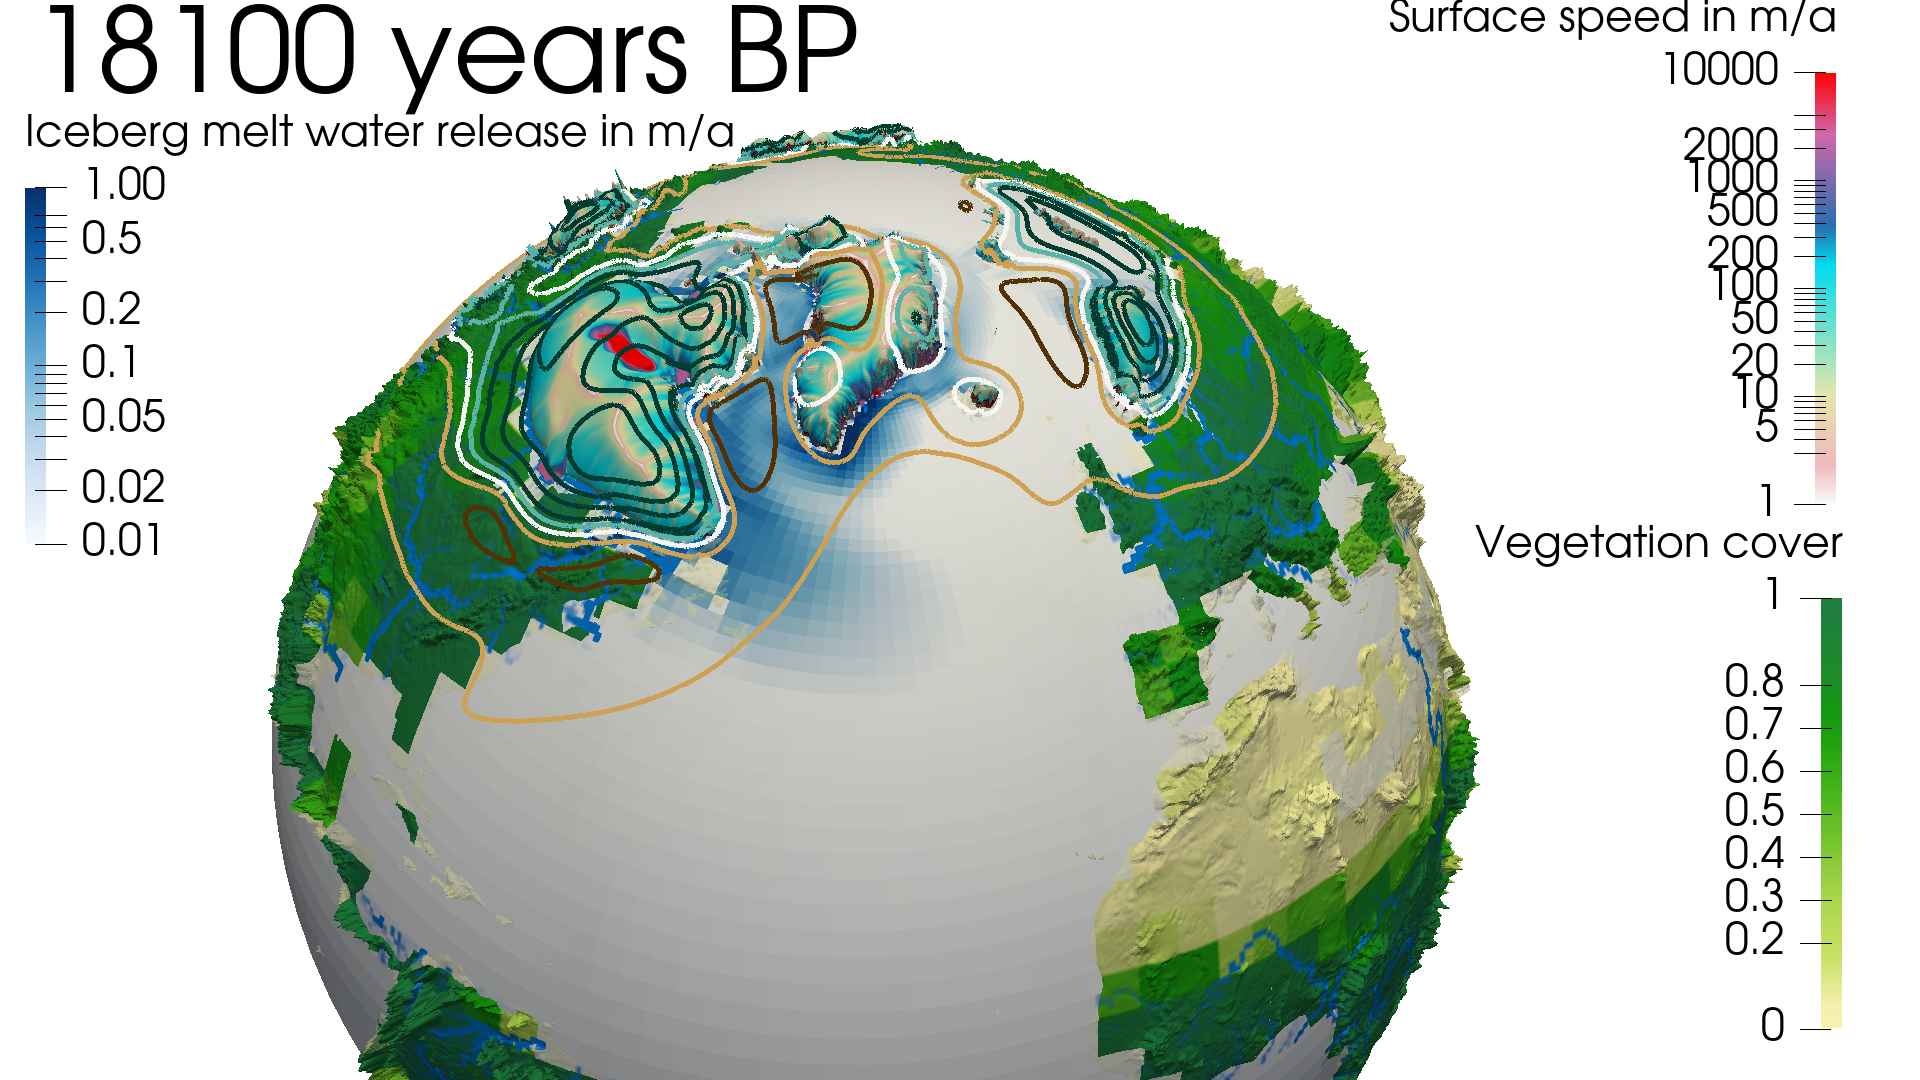
Create a multi-variable image / animation from a coupled ice sheet - climate simulation#
This example will show how to create an animation based on ocean, vegetation, solid earth, river runoff, and ice sheet data. This requires substantial pre-processing, that will only be outlined here. All preprocessed files can be downloaded from the DKRZ SwiftBrowser
Note
You can download all files by:
git clone git@github.com:ESiWACE/hpda-vis-training.git
cd hpda-vis-training/Training2021/Session2/
make

In this example we assume a very basic level of familiarity with Paraview. If you feel lost in between, consider looking at Create an image of sea surface speeds. This multi-variable visualization requires a substantial amount of Pre-processing. We will skip these steps for now, as they are different for any two data sets.
Repeat the same exercise including Convert cell data to point data for
vilma_ss_777.nc(variabletopgfor the topography anddelta_topgfor the isolines - copy and paste as appropriate). That should get you isolines on land.Also apply the contour to the pure Cell Data to Point Data filter, to get isolines on the ocean.