ParaView#
Paraview is an open-source software package for scientific visualization and data exploriation. It supports netcdf files and various other formats. The standard netCDF reader supports regular grids (e.g. ECHAM, MPI-OM). On mistral, we provide several versions with a special CDI-based reader, that supports irregular triangular meshes (e.g. ICON). We also have development versions, that support grib files, as well as grids with arbritrary numbers of vertices per cell (e.g. FESOM, IFS). Paraview comes with extensive documentation and a user forum. Below, we provide a couple examples and hints from our work with weather and climate data.
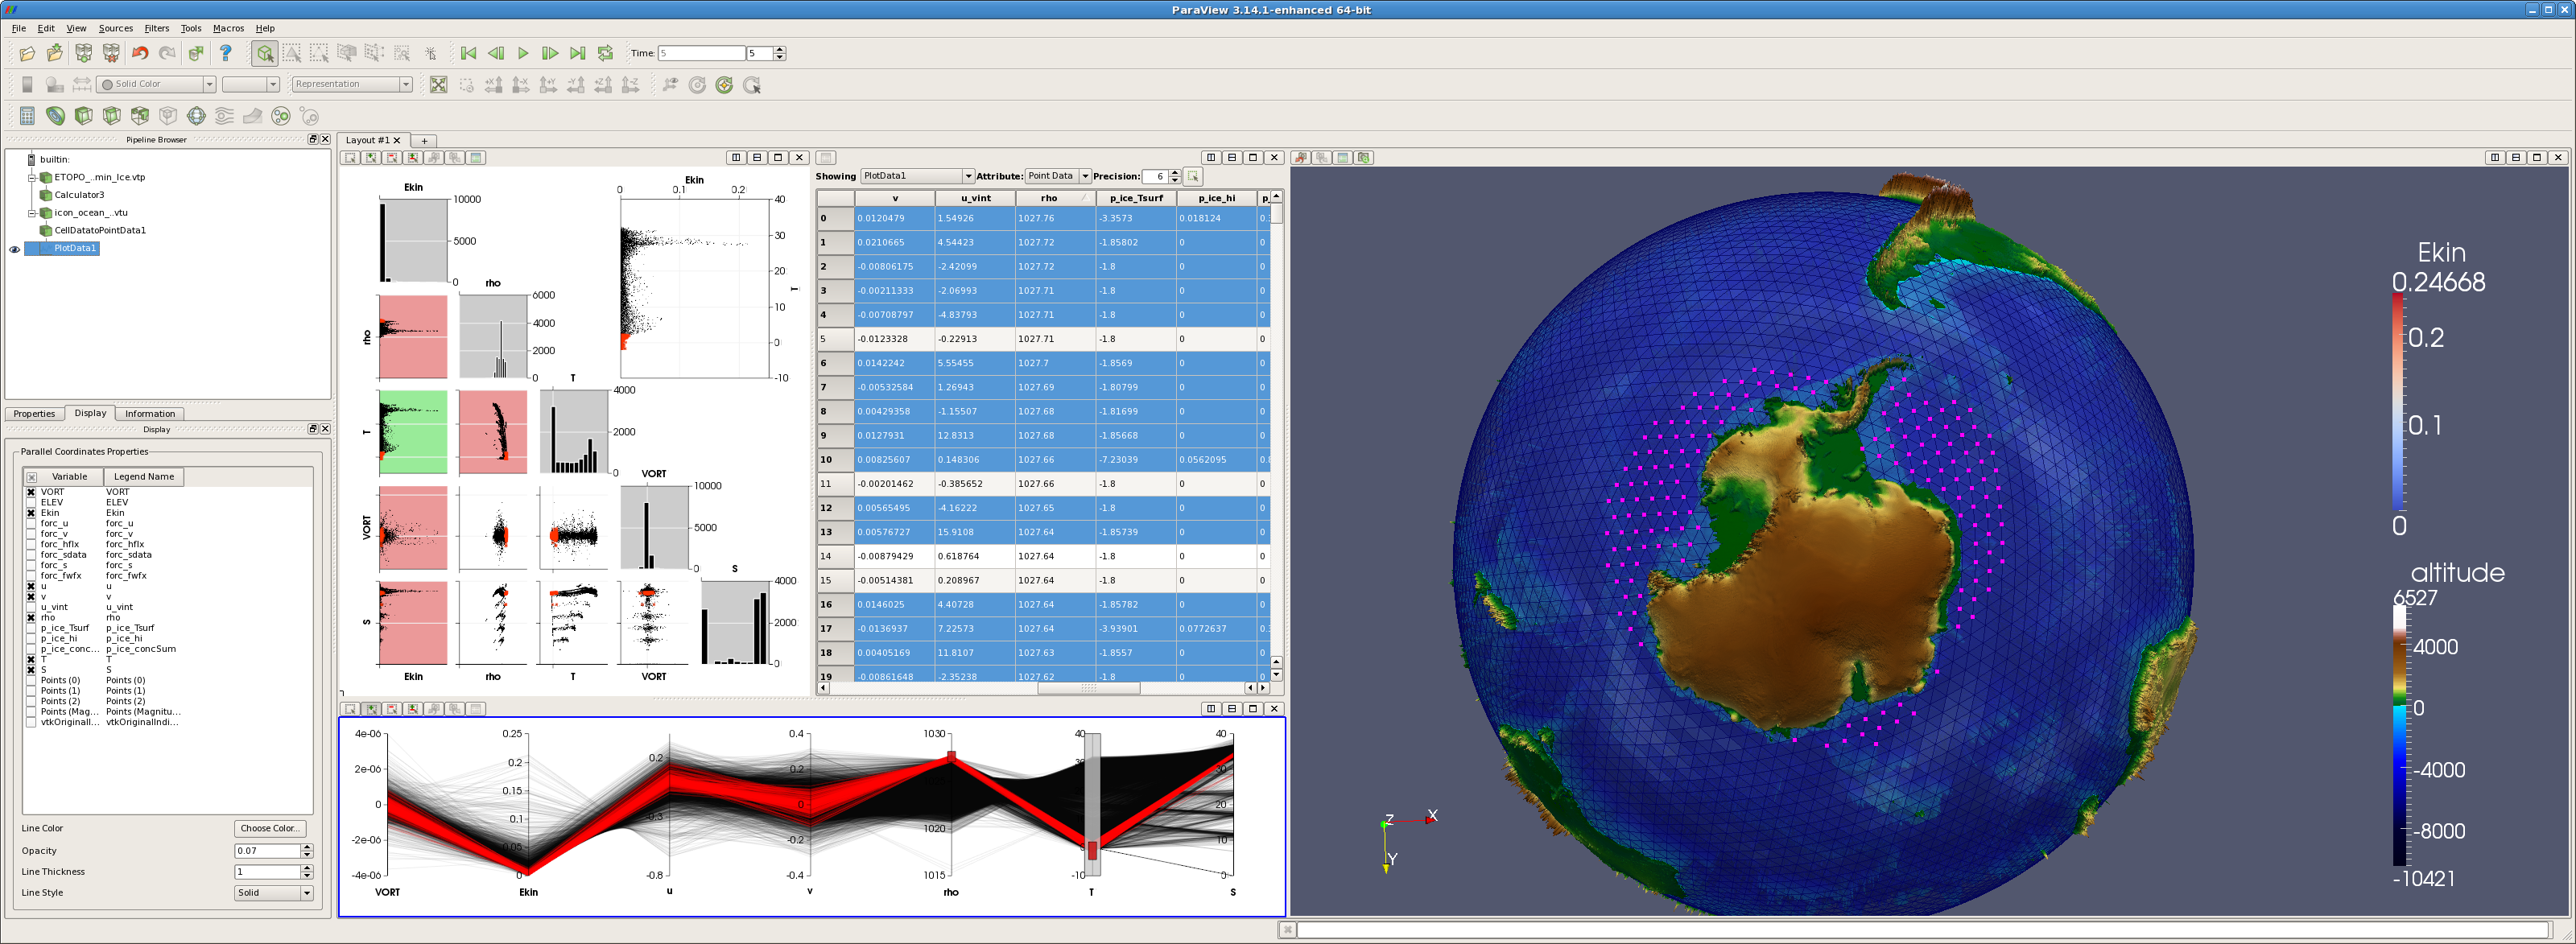
Figure 1: In-depth exploration of an ICON ocean data set in ParaView#
The above example shows a complex visualization of an ICON ocean data set using ParaView. The viewport on the right displays the data, the selection made, as well as the Earth’s topography. The three viewports on the left hand side are used to specify the selection, based on a scatterplot matrix and parallel coordinates. These techniques are especially well-suited for an in-depth data analysis and exploration.
Documentation for visualization with Paraview#
Start by having a look at The Paraview main screen or take a guided tour and Create an image of sea surface speeds, or follow instructions in the DKRZ ParaView tutorial document, a protoype of an ParaView tutorial document written at DKRZ.
Or chose from the full menue:
Tutorials and instructions:
- ParaView on Levante
- Paraview Examples
- Create an image of sea surface speeds
- Display clouds as a semi-transparent overlay
- Create isosurfaces of ocean current speed
- Create a multi-variable image / animation from a coupled ice sheet - climate simulation
- Prepare a regional land and ocean map background
- Streamline seeding in vector data
- Volume rendering of (NARVAL II) ICON data
- Isosurfaces and isocontours in regular lat-lon data
- DKRZ ParaView tutorial document
- The Paraview main screen
- Camera and perspective
- Colormaps
- Export
- Filters
- Combine files with AppendAttributes
- Extrude a land surface based on topography
- Apply a calculator to convert u and v into speed
- Check if you have cell or point data
- Convert cell data to point data
- Use the contour filter to display isolines
- Using an earth texture as background
- Extrusion of topography and bathymetry
- Compute isosurfaces from the point data
- Add an image as texture (plane) in the background
- Add an image as texture on a sphere
- Use a threshold to get rid of missing missing values in ICON Ocean
- NetCDF: Date and time annotation
- Light
- Readers
- Rendering Techniques
- Technical