Analysis history#
All information about performed analyses with Freva is saved in a MySQL database. When a plugin is started, the System Core sets certain information through the PluginManager. Each evaluation receives a unique identification number (ID), which is then combined with the user’s ID, the plugin name, a time stamp, and status. The configuration parameters of the plugin, including possible data retrieval options (e.g., Solr fields), are stored in MySQL.
This command gives direct access to all analysis performed by the user and their result directories. Distinct IDs are utilized to sort all results and show their respective history entries. Furthermore, the history holds all configurations and starting commands, which are editable and restartable.
Help#
$ freva --history --help
Displays the last 10 entries with a one-line compact description.
The first number you see is the entry id, which you might use to select single entries.

DATE FORMAT
   Dates can be given in "YYYY-MM-DD HH:mm:ss.n" or any less accurate subset of it.
   These are all valid: "2012-02-01 10:08:32.1233431", "2012-02-01 10:08:32",
   "2012-02-01 10:08", "2012-02-01 10", "2012-02-01", "2012-02", "2012".

   These are *NOT*: "01/01/2010", "10:34", "2012-20-01"

   Missing values are assumed to be the minimal allowed value. For example:
   "2012" == "2012-01-01 00:00:00.0"

   Please note that in the shell you need to escape spaces.
   All these are valid examples (at least for the bash shell):
   freva --history --since=2012-10-1\ 10:35
   freva --history --since=2012-10-1" "10:35'

Usage: freva --history [options]

Options:
  -d, --debug       turn on debugging info and show stack trace on exceptions.
  -h, --help        show this help message and exit
  --full_text       If present shows the complete configuration stored
  --return_command  Show freva commands belonging to the history entries
                    instead of the entries themself.
  --limit=N         n is the number of entries to be displayed
  --plugin=NAME     Display only entries from plugin "name"
  --since=DATE      Retrieve entries older than date (see DATE FORMAT)
  --until=DATE      Retrieve entries newer than date (see DATE FORMAT)
  --entry_ids=IDs   Select entries whose ids are in "ids" (e.g. entry_ids=1,2
                    or entry_ids=5)
Usage in CLI#
To get the history (is limited to the 10 latest entries, i.e. analysis that were run, by default):
$ freva --history
901756) pca [2020-11-17 17:12:32] finished {"eofs": 10, "shiftlats": false, "latname": "lat", "pcafile": "erai...
901692) exampleplugin [2020-11-11 20:36:58] finished {"product": "reanalysis", "dryrun": false, "institute": "ecmwf", "c...
901690) psi [2020-11-10 17:02:16] finished {"product": "output1", "sel_extr": "10,5,3", "cmor_table": "day", "...
901687) psi [2020-11-10 15:26:28] finished {"product": "output1", "sel_extr": "10,5,3", "cmor_table": "day", "...
901686) psi [2020-11-10 15:17:40] finished {"product": "output1", "sel_extr": "10,5,3", "cmor_table": "day", "...
901685) psi [2020-11-10 15:17:22] broken {"product": "output1", "sel_extr": "10,5,3", "cmor_table": "day", "...
901684) psi [2020-11-10 15:16:56] finished {"product": "eur-22", "sel_extr": "100", "cmor_table": "day", "time...
901678) psi [2020-11-10 11:10:13] finished {"product": "eur-22", "sel_extr": "100", "cmor_table": "day", "time...
901676) psi [2020-11-10 11:04:59] finished {"product": "eur-22", "sel_extr": "100", "cmor_table": "day", "time...
901674) psi [2020-11-10 10:50:32] finished {"product": "eur-22", "sel_extr": "100", "cmor_table": "day", "time...
It shows just the 10 latest entries, i.e. the 10 latest analysis that were performed. The number of listed runs can be set by --limit=N.
We can also limit our search to certain time range with --since=DATE and/or --until=DATE. Freva is very lenient with the date format, anywhere from YYYY-MM-DD HH:mm:ss.n to YYYY.
$ freva --history --since="2021-02-01 09:34:59.5" --until="2022"
909814) psi [2021-12-14 13:41:01] finished {"product": "cmip", "dryrun": true, "sel_extr": "10,5,3", "cmor_tab...
909812) psi [2021-12-12 22:51:36] broken {"product": "cmip", "dryrun": false, "sel_extr": "10,5,3", "cmor_ta...
909773) psi [2021-12-09 09:56:11] finished {"product": "cmip", "dryrun": false, "sel_extr": "10,5,3", "cmor_ta...
909772) murcss [2021-12-08 13:59:20] broken {"maskMissingValues": true, "model2": "mpi-esm-lr", "model1": "mpi-...
909752) murcss [2021-12-08 08:37:56] finished {"maskMissingValues": true, "model2": "cesm", "model1": "cesm", "va...
909722) regimes [2021-12-07 13:50:48] finished {"product": "reanalysis", "dryrun": false, "cdo": "-daymean", "cmor...
909721) regimes [2021-12-07 13:05:10] finished {"product": "reanalysis", "dryrun": false, "cdo": "-daymean", "cmor...
909718) regimes [2021-12-07 12:15:33] finished {"product": "reanalysis", "dryrun": false, "cdo": "-daymean", "cmor...
909717) regimes [2021-12-07 12:12:33] finished {"product": "reanalysis", "dryrun": false, "cdo": "-daymean", "cmor...
909716) regimes [2021-12-07 12:08:25] finished {"product": "reanalysis", "dryrun": false, "cdo": "-daymean", "cmor...
But remember that the query is limited to the latest 10 entries! we need to explicitly tell if we want more:
$ freva --history --since="2021-02-01 09:34:59.5" --until="2022" --limit=10000 | wc -l
 926
--full_text offers the complete overview of the history, showing the parameter configuration and input/output directories:
$ freva --history --plugin=pca --limit=1 --full_text
901756) pca(3, 1, 0) dfed9b1d7cec8193a3d22ef75586799b8f65feb0 [2020-11-17 17:12:32] finished
Configuration:
     areaweight=True
          boots=100
      bootstrap=False
    eigvalscale=True
           eofs=10
          input=/pf/b/b381187/WORKSHOP/data/eraint-psl-box-djf.nc
        latname=lat
   missingvalue=1e+38
      normalize=True
      outputdir=/work/bmx825/miklip-work/k204229/evaluation_system/output/pca/20200728_141242
    outputplots=/work/bmx825/miklip-work/k204229/evaluation_system/plots/pca/20200728_141242
     outputtype=eps
        pcafile=eraint.pca.djf.nc
     principals=True
     projection=/home/dkrz/b381187/WORKSHOP/data/eraint-psl-box-djf.nc.pro.psl.nc
        session=1
      shiftlats=False
     testorthog=False
        threads=8
       variable=psl
The option --return_command shows the freva command of a particular configuration. This a useful way to re-run tools with a particular configuration. Here an example for the latest used configuration with
the tool movieplotter:
$ freva --history --plugin=movieplotter --limit=1 --return_command

/mnt/lustre01/work/bmx828/miklip-ces/freva/bin/freva --plugin movieplotter range_list='auto' collage='False' earthball='False' cdo_options='-seltimestep,1' ntasks='35' loops='0' animate='True' outputdir='/work/bmx825/miklip-work/k204229/evaluation_system/output/movieplotter/20200915_123108' secperpic='1.0' input='u'/work/bmx825/data4miklip/data4xces/CMOR/reanalysis/reanalysis/NOAA-CIRES/gfs/20crv3/3hr/atmos/psl/r10i1p1/psl_3hr_reanalysis_20crv3_r10i1p1_2015010100-2015123121.nc'' colortable='ncl_default' reverse='False' level='0' work='/work/bmx825/miklip-work/k204229/evaluation_system/cache/movieplotter' fillmode='AreaFill' seldate='None' cacheclear='True' resolution='800'
This might seem convoluted but it is a very useful expression, a re-run of the tool in batch shell could be easily performed by simply:
$ $(freva --history --plugin=movieplotter --limit=1 --return_command)
Usage in web#
The usage through web is at follows, from RegIKlim’s page:
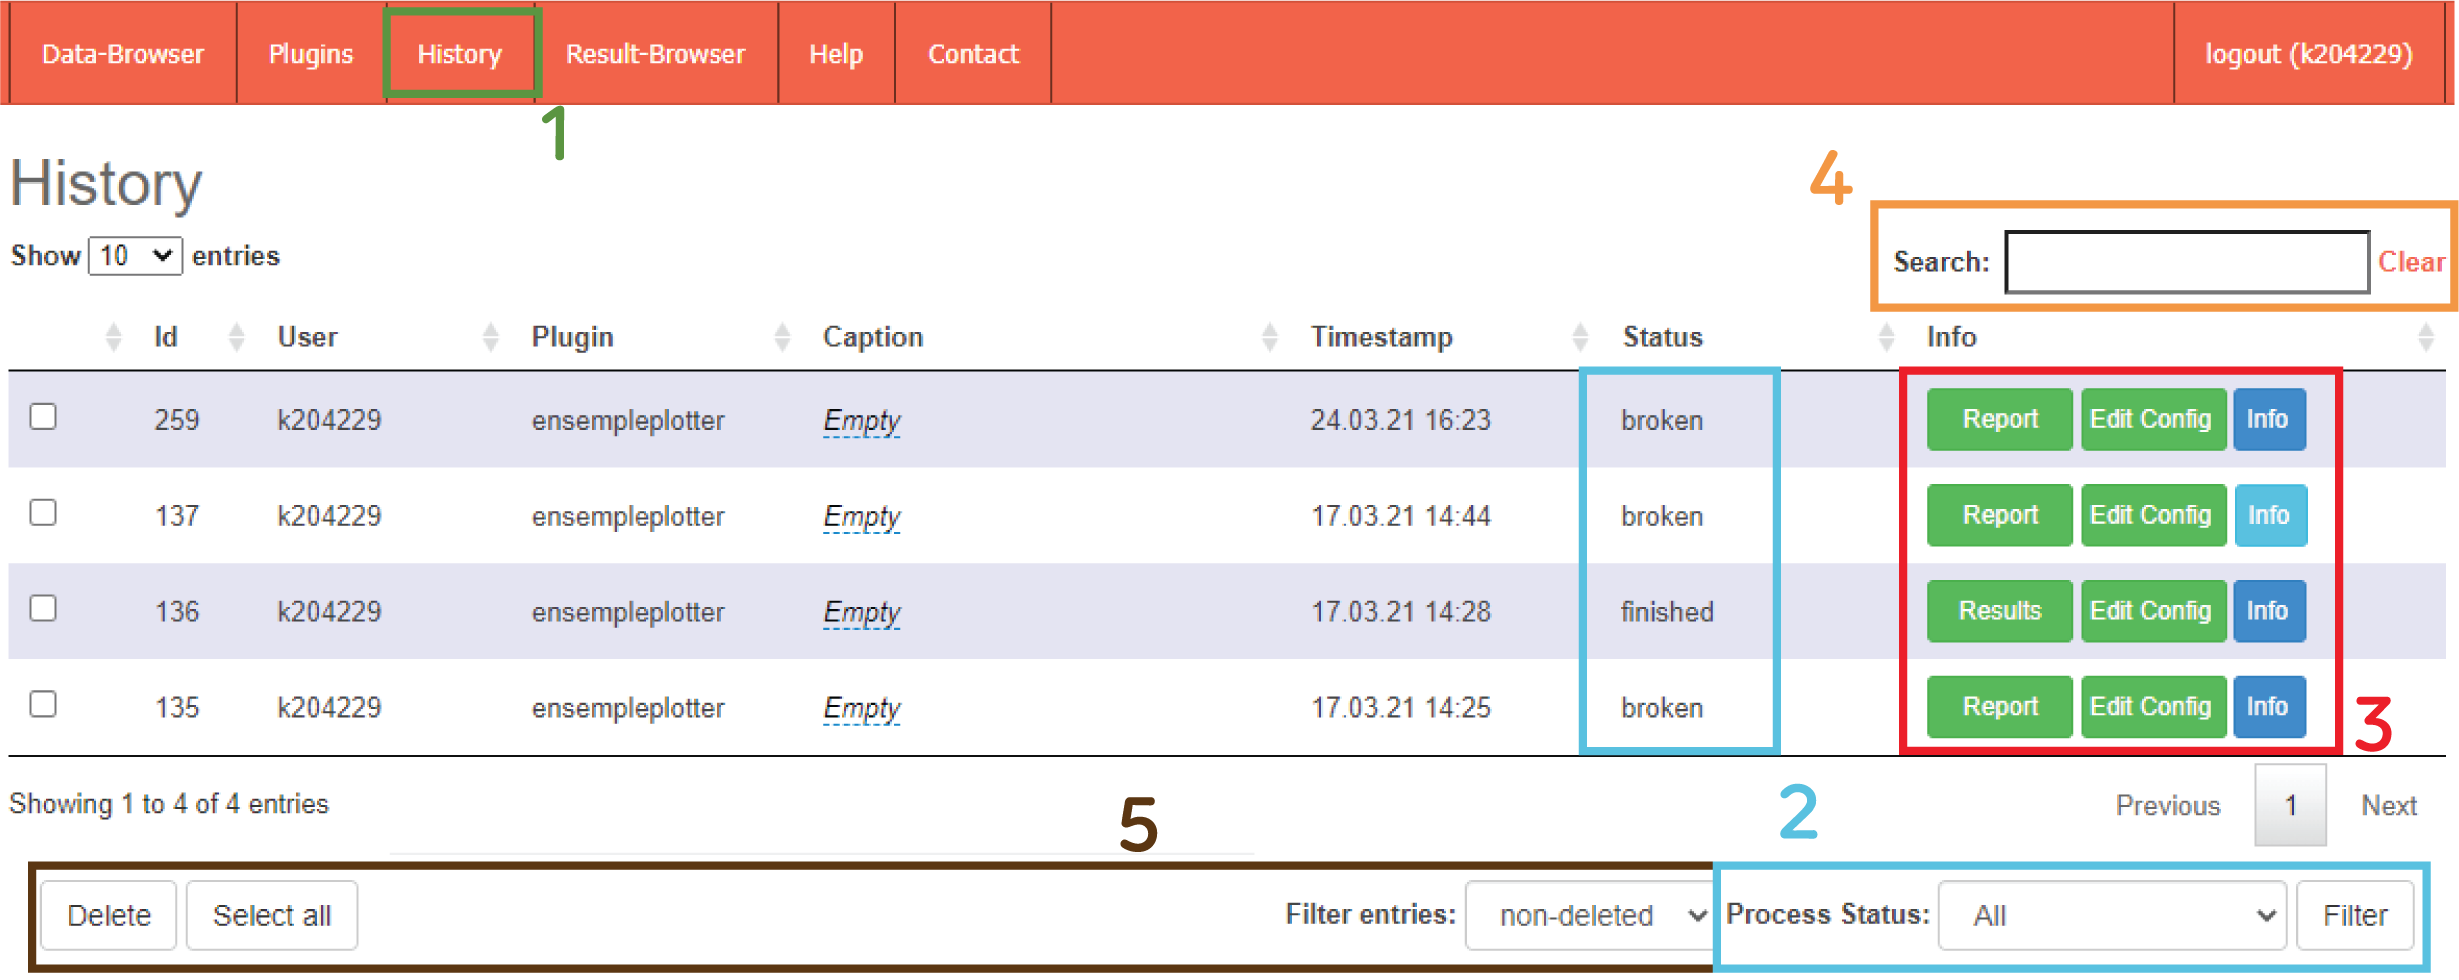
The
Historyis accessed clicking its corresponding tab (box 1). In this menu have the table corresponding to our own history of runs, either those run via CLI (in interactive of batchmode) or via web. This table shows the Freva ID of the job run, the user, the plugin used, the caption (it can be edited clicking on it), the time when the job was run, the status of the job (2) and some more info (3).The status of the job (2) can be either:
finished: succesfull run.finished (no output): run with no plots/animations.broken: broken process due to wrong configuration.running: running process.scheduled: process scheduled for running.
The info section (3) gives quick information of the configuration hovering over the
Infobutton and whether the job was run on batchmode (dark blue) or interactive mode (light blue). It also allow us to land in the result page of the job (Result/Reportbutton) or to edit the configuration of the job (Edit Configwould lead us to the setup page of the plugin with the prefiled configuration).The search bar (4) let us filter the table by many means (tool name, certain configuration option etc.).
History also allows us to “delete” a result from the table (5). This action will not actually delete the configuration but take it out from the table. It can, however, be retrieved with the Filter option.